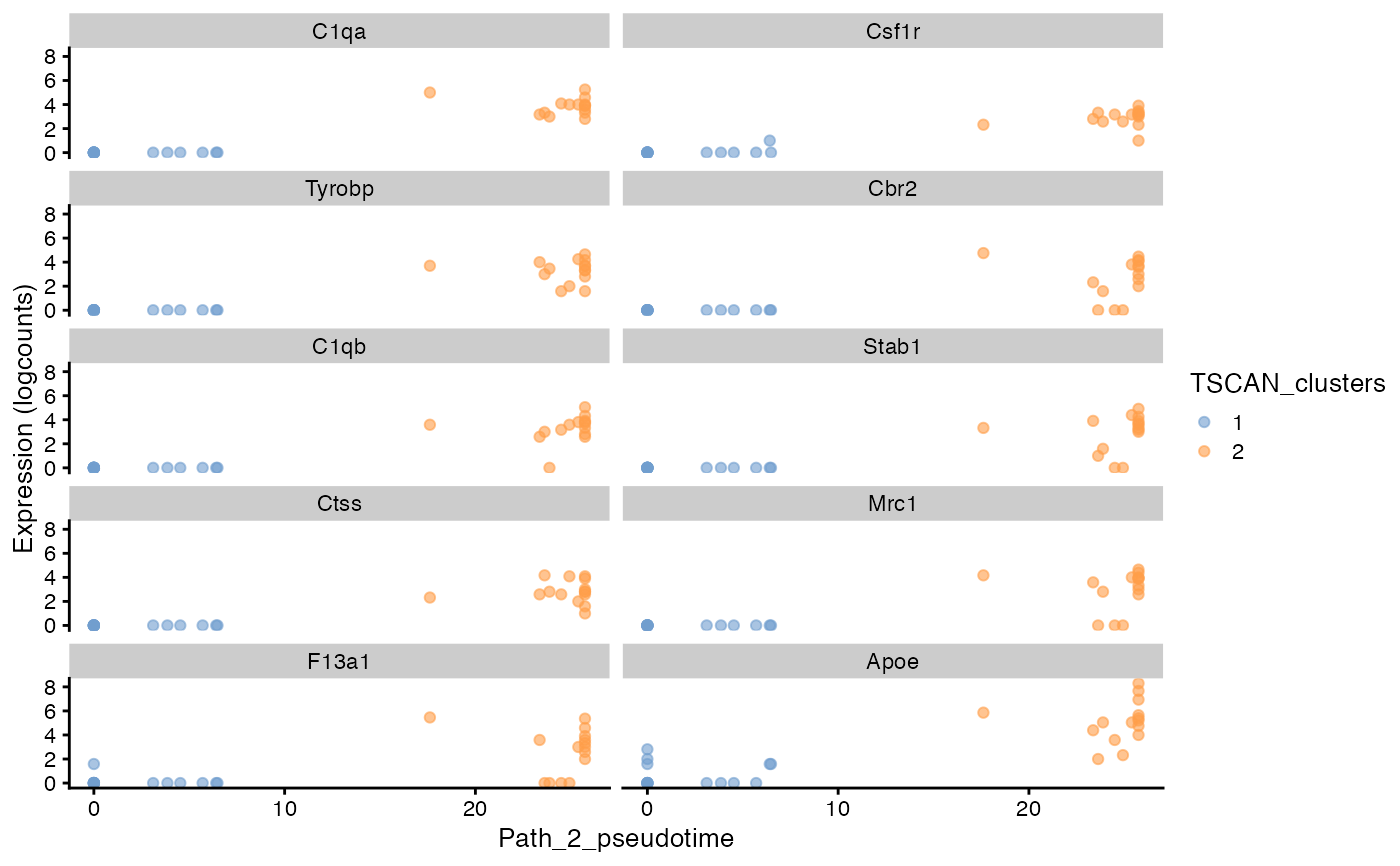
Plot expression changes of top features along a TSCAN pseudotime path
Source:R/runTSCAN.R
plotTSCANPseudotimeGenes.RdA wrapper function which visualizes outputs from the
runTSCANDEG function. Plots the genes that increase or decrease
in expression with increasing pseudotime along the path in the MST.
runTSCANDEG has to be run in advance with using the same
pathIndex of interest.
plotTSCANPseudotimeGenes(
  inSCE,
  pathIndex,
  direction = c("increasing", "decreasing"),
  topN = 10,
  useAssay = NULL,
  featureDisplay = metadata(inSCE)$featureDisplay
)
Arguments
- inSCE
Input SingleCellExperiment object.
- pathIndex
Path index for which the pseudotime values should be used. Should have being used in
runTSCANDEG.- direction
Should we show features with expression increasing or decreeasing along the increase in TSCAN pseudotime? Choices are
"increasing"or"decreasing".- topN
An integer. Only to plot this number of top genes that are increasing/decreasing in expression with increasing pseudotime along the path in the MST. Default 10
- useAssay
A single character to specify a feature expression matrix in
assaysslot. The expression of top features from here will be visualized. DefaultNULLuse the one used forrunTSCANDEG.- featureDisplay
Specify the feature ID type to display. Users can set default value with
setSCTKDisplayRow.NULLor"rownames"specifies the rownames ofinSCE. Other character values indicatesrowDatavariable.
Value
A .ggplot object with the facets of the top genes. Expression
on y-axis, pseudotime on x-axis.
Examples
data("mouseBrainSubsetSCE", package = "singleCellTK")
mouseBrainSubsetSCE <- runTSCAN(inSCE = mouseBrainSubsetSCE,
                                useReducedDim = "PCA_logcounts")
#> Mon Dec 19 18:08:43 2022 ... Running 'scran SNN clustering' with 'louvain' algorithm
#> Mon Dec 19 18:08:44 2022 ...   Identified 2 clusters
#> Mon Dec 19 18:08:44 2022 ... Running TSCAN to estimate pseudotime
#> Mon Dec 19 18:08:44 2022 ...   Clusters involved in path index 2 are: 1, 2
#> Mon Dec 19 18:08:44 2022 ...   Number of estimated paths is 1
terminalNodes <- listTSCANTerminalNodes(mouseBrainSubsetSCE)
mouseBrainSubsetSCE <- runTSCANDEG(inSCE = mouseBrainSubsetSCE,
                                   pathIndex = terminalNodes[1])
plotTSCANPseudotimeGenes(mouseBrainSubsetSCE,
                         pathIndex = terminalNodes[1],
                         useAssay = "logcounts")