Plot feature expression on cell 2D embedding with MST overlaid
Source:R/runTSCAN.R
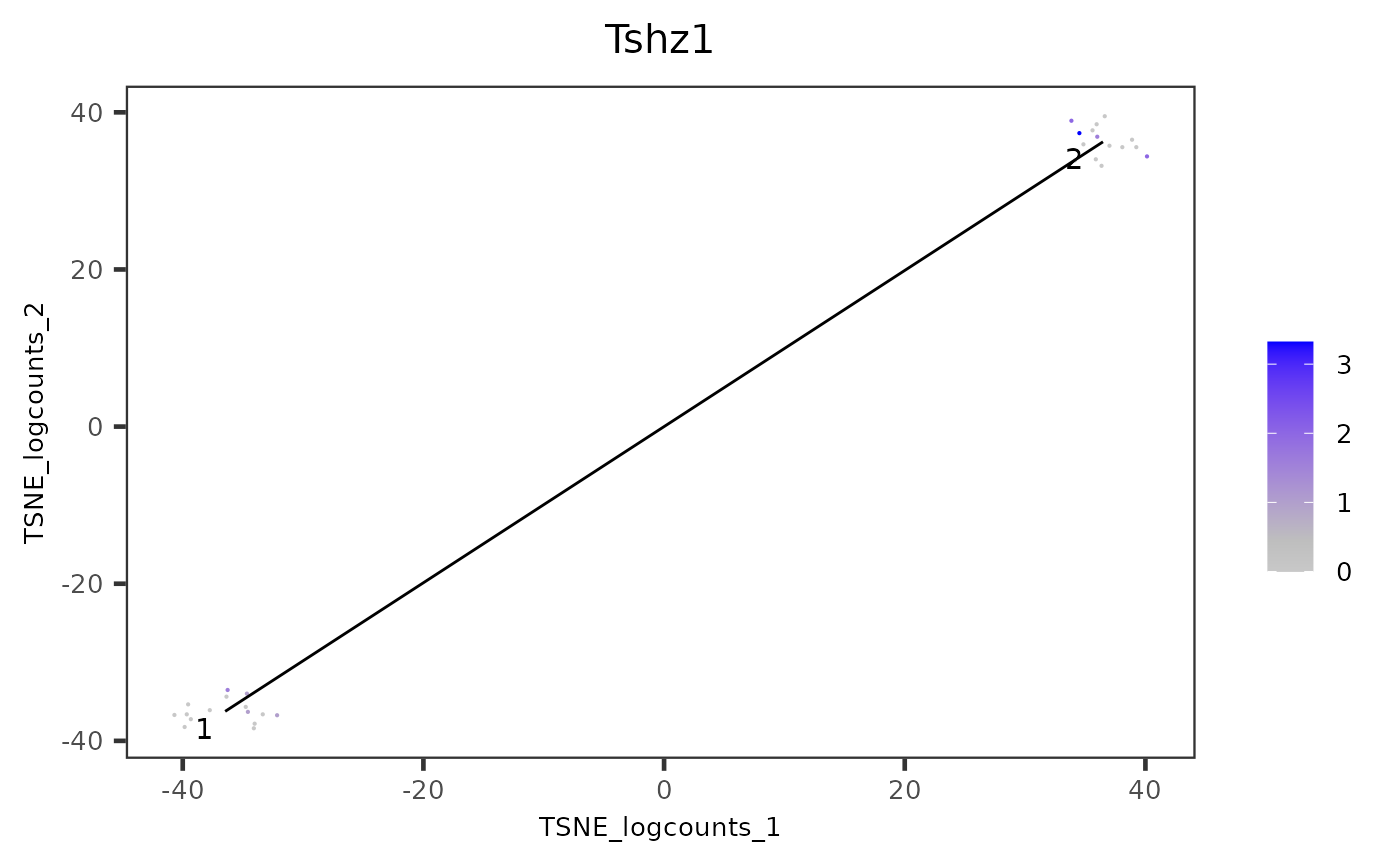
plotTSCANDimReduceFeatures.RdA wrapper function which plots all cells or cells in chosen cluster. Each point is a cell colored by the expression of a feature of interest, the relevant edges of the MST are overlaid on top.
plotTSCANDimReduceFeatures(
  inSCE,
  features,
  useReducedDim = "UMAP",
  useAssay = "logcounts",
  by = "rownames",
  useCluster = NULL,
  featureDisplay = metadata(inSCE)$featureDisplay,
  combinePlot = c("all", "none")
)
Arguments
- inSCE
Input SingleCellExperiment object.
- features
Choose the feature of interest to explore the expression level on the trajectory. Required.
- useReducedDim
A single character for the matrix of 2D embedding. Should exist in
reducedDimsslot. Default"UMAP".- useAssay
A single character for the feature expression matrix. Should exist in
assayNames(inSCE). Default"logcounts".- by
Where should
featuresbe found?NULL,"rownames"forrownames(inSCE), otherwise will be regarded asrowDatavariable.- useCluster
Choose specific clusters where gene expression needs to be visualized. By default
NULL, all clusters are chosen.- featureDisplay
Specify the feature ID type to display. Users can set default value with
setSCTKDisplayRow.NULLor"rownames"specifies the rownames ofinSCE. Other character values indicatesrowDatavariable.- combinePlot
Must be either
"all"or"none"."all"will combine plots of each feature into a single.ggplotobject, while"none"will output a list of plots. Default"all".
Value
A .ggplot object of cell scatter plot, colored by the
expression of a gene of interest, with the layer of trajectory.
Examples
data("mouseBrainSubsetSCE", package = "singleCellTK")
mouseBrainSubsetSCE <- runTSCAN(inSCE = mouseBrainSubsetSCE,
                                useReducedDim = "PCA_logcounts")
#> Sat Mar 18 10:30:11 2023 ... Running 'scran SNN clustering' with 'louvain' algorithm
#> Sat Mar 18 10:30:12 2023 ...   Identified 2 clusters
#> Sat Mar 18 10:30:12 2023 ... Running TSCAN to estimate pseudotime
#> Sat Mar 18 10:30:12 2023 ...   Clusters involved in path index 2 are: 1, 2
#> Sat Mar 18 10:30:12 2023 ...   Number of estimated paths is 1
plotTSCANDimReduceFeatures(inSCE = mouseBrainSubsetSCE,
                           features = "Tshz1",
                           useReducedDim = "TSNE_logcounts")