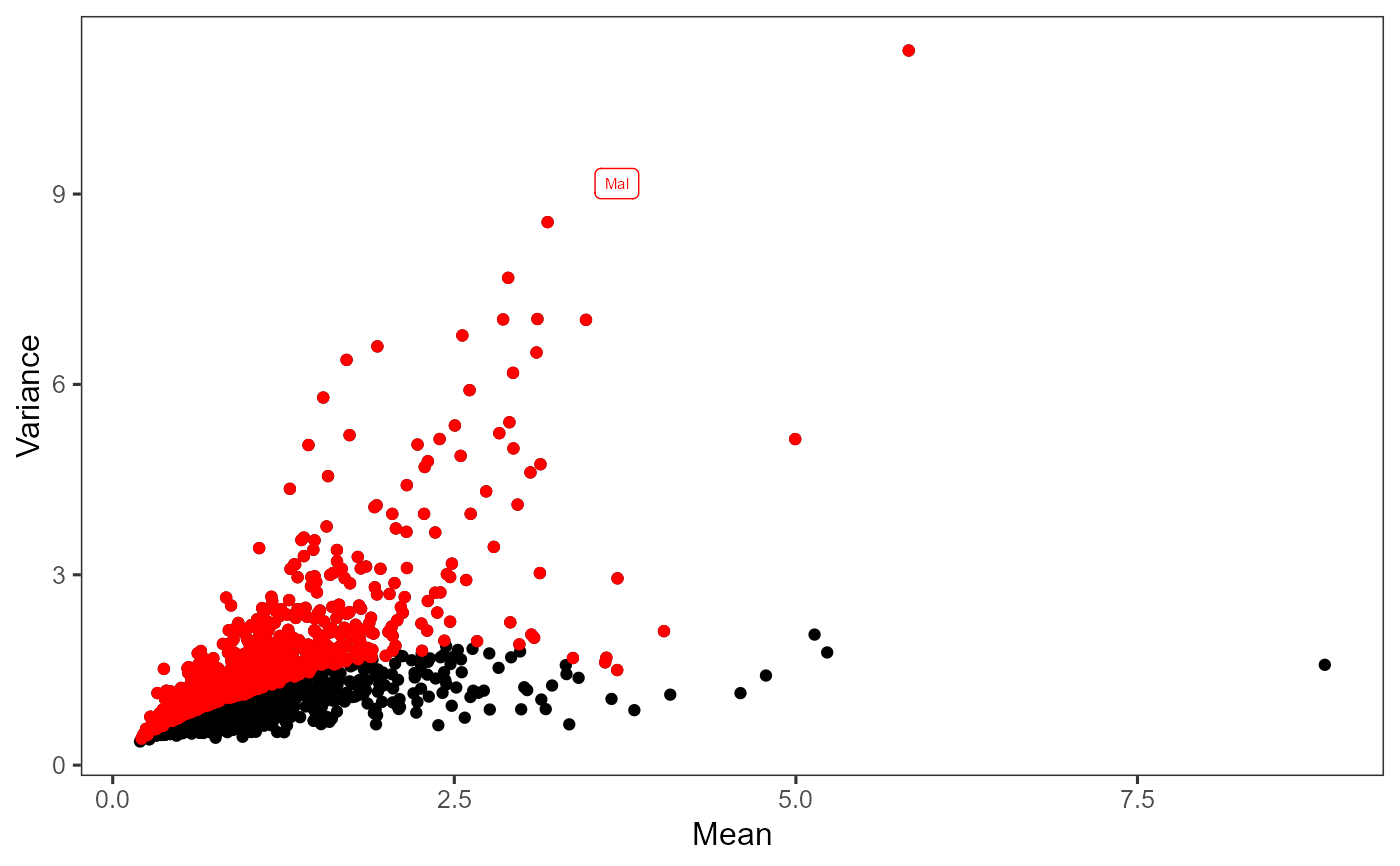
Plot highly variable genes
plotTopHVG(
  inSCE,
  method = c("vst", "mean.var.plot", "dispersion", "modelGeneVar"),
  hvgList = NULL,
  n = NULL,
  labelsCount = NULL
)
Arguments
- inSCE
Input
SingleCellExperimentobject containing the computations.- method
Select either "vst", "mean.var.plot", "dispersion" or "modelGeneVar".
- hvgList
Character vector indicating the labels of highly variable genes.
- n
Specify the number of top genes to highlight in red. If
hvgListparameter is not provided, this parameter can be used simply to specify the number of top genes to highlight in red.- labelsCount
Specify the number of data points/genes to label. By default, all top genes will be labeled.
Value
plot object
Examples
data("mouseBrainSubsetSCE", package = "singleCellTK")
mouseBrainSubsetSCE <- scranModelGeneVar(mouseBrainSubsetSCE, "logcounts")
#> Warning: collapsing to unique 'x' values
plotTopHVG(mouseBrainSubsetSCE, method = "modelGeneVar",
           n = 1000, labelsCount = 0)
#> Warning: cannot xtfrm data frames