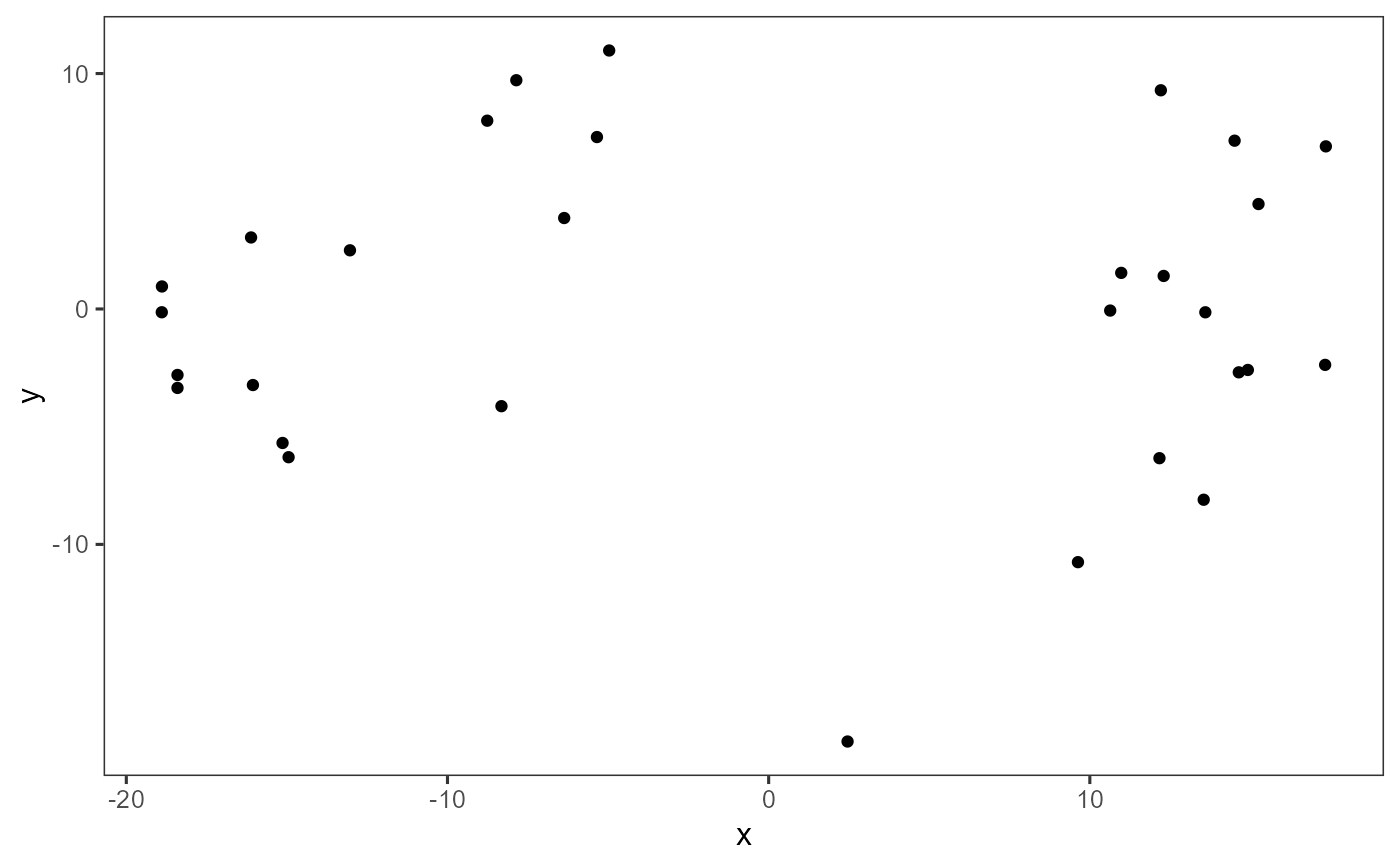
Plot dimensionality reduction from computed metrics including PCA, ICA, tSNE and UMAP
Source:R/plotDimRed.R
plotDimRed.RdPlot dimensionality reduction from computed metrics including PCA, ICA, tSNE and UMAP
plotDimRed(
  inSCE,
  useReduction,
  showLegend = FALSE,
  xAxisLabel = NULL,
  yAxisLabel = NULL
)
Arguments
| inSCE | Input SCE object |
|---|---|
| useReduction | Reduction to plot |
| showLegend | If legends should be plotted or not |
| xAxisLabel | Specify the label for x-axis. Default is |
| yAxisLabel | Specify the label for y-axis. Default is |
Value
plot object
Examples
data("mouseBrainSubsetSCE", package = "singleCellTK")
plotDimRed(mouseBrainSubsetSCE, "PCA_logcounts")