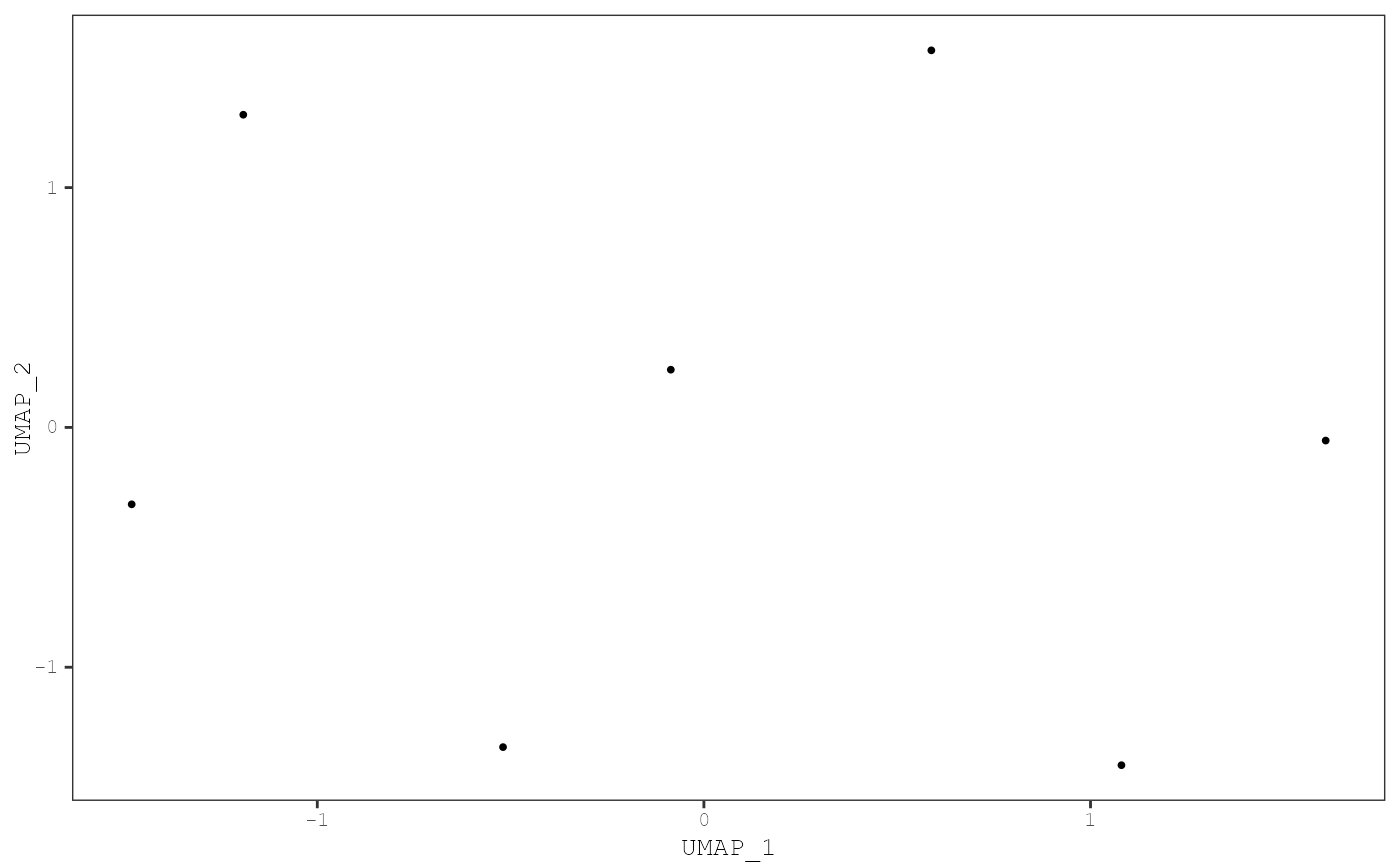
Plots samples on a UMAP scatterplot. Samples can be colored by the levels of mutational signatures or by a annotation variable.
Usage
plot_umap(
  musica,
  model_name,
  modality = "SBS96",
  result_name = "result",
  color_by = c("signatures", "annotation", "cluster", "none"),
  proportional = TRUE,
  annotation = NULL,
  point_size = 0.7,
  same_scale = TRUE,
  add_annotation_labels = FALSE,
  annotation_label_size = 3,
  annotation_text_box = TRUE,
  plotly = FALSE,
  clust = NULL,
  legend = TRUE,
  strip_axes = FALSE
)
Arguments
- musica
A
musicaobject containing a mutational signature discovery or prediction.- model_name
The name of the desired model.
- modality
The modality of the model. Must be "SBS96", "DBS78", or "IND83". Default
"SBS96".- result_name
Name of the result list entry containing the model.Default
"result".- color_by
One of
"signatures","annotation", or"none". If"signatures", then one UMAP scatterplot will be generated for each signature and points will be colored by the level of that signature in each sample. Ifannotation, a single UMAP will be generated colored by the annotation selected using the parameterannotation. If"none", a single UMAP scatterplot will be generated with no coloring. Default"signature".- proportional
If
TRUE, then the exposures will be normalized to between 0 and 1 by dividing by the total number of counts for each sample. DefaultTRUE.- annotation
Sample annotation used to color the points. One used when
color_by = "annotation". DefaultNULL.- point_size
Scatter plot point size. Default
0.7.- same_scale
If
TRUE, then all points will share the same color scale in each signature subplot. IfFALSE, then each signature subplot will be colored by a different scale with different maximum values. Only used whencolor_by = "signature". Setting toFALSEis most useful when the maximum value of various signatures are vastly different from one another. DefaultTRUE.- add_annotation_labels
If
TRUE, labels for each group in theannotationvariable will be displayed. Only used ifcolor_by = "annotation". This not recommended if the annotation is a continuous variable. The label is plotting using the centriod of each group within theannotationvariable. DefaultFALSE.- annotation_label_size
Size of annotation labels. Only used if
color_by = "annotation"andadd_annotation_labels = TRUE. Default3.- annotation_text_box
Place a white box around the annotation labels to improve readability. Only used if
color_by = "annotation"andadd_annotation_labels = TRUE. DefaultTRUE.- plotly
If
TRUE, the the plot will be made interactive usingplotly. Not used ifcolor_by = "signature"andsame_scale = FALSE. DefaultFALSE.- clust
Add cluster labels as annotation
- legend
Plot legend
- strip_axes
Remove axes labels for cleaner looking plots
See also
See create_umap to generate a UMAP in a musica result.
Examples
data(res_annot)
create_umap(res_annot, "res_annot")
#> The parameter 'n_neighbors' cannot be bigger than the total number of samples. Setting 'n_neighbors' to 7.
plot_umap(res_annot, "res_annot", color_by = "none")
