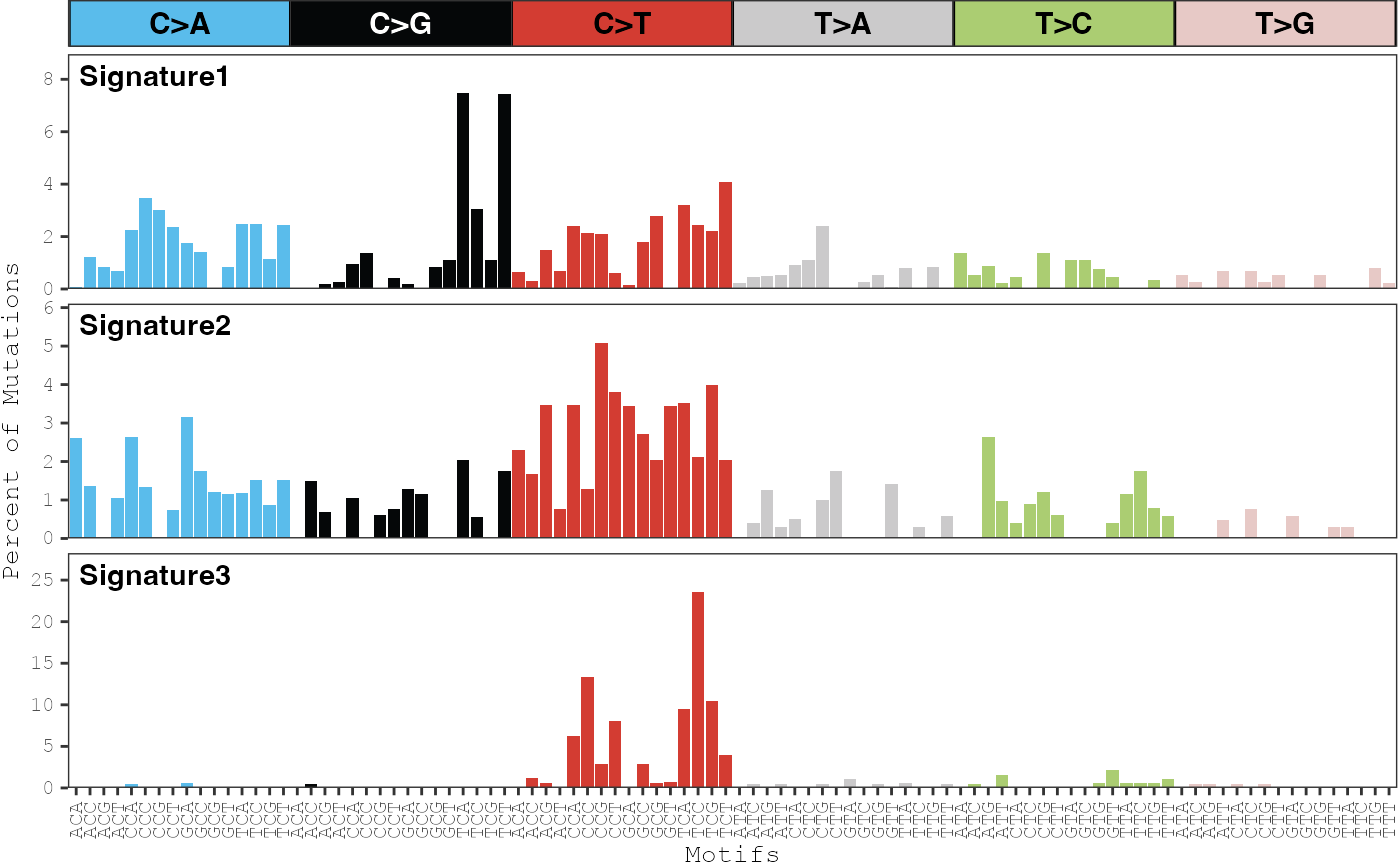
After mutational signature discovery has been performed, this function
can be used to display the distribution of each mutational signature. The
color_variable and color_mapping parameters can be used
to change the default color scheme of the bars.
Usage
plot_signatures(
  musica,
  model_id,
  modality = "SBS96",
  result_name = "result",
  color_variable = NULL,
  color_mapping = NULL,
  text_size = 10,
  show_x_labels = TRUE,
  show_y_labels = TRUE,
  same_scale = FALSE,
  y_max = NULL,
  annotation = NULL,
  percent = TRUE,
  plotly = FALSE
)
Arguments
- musica
A
musicaobject containing a mutational discovery or prediction.- model_id
The name of the model to plot.
- modality
The modality of the signatures to plot. Must be "SBS96", "DBS78", or "IND83". Default
"SBS96".- result_name
Name of the result list entry containing the signatures to plot. Default
"result".- color_variable
Name of the column in the variant annotation data.frame to use for coloring the mutation type bars. The variant annotation data.frame can be found within the count table of the
musicaobject. IfNULL, then the default column specified in the count table will be used. DefaultNULL.- color_mapping
A character vector used to map items in the
color_variableto a color. The items incolor_mappingcorrespond to the colors. The names of the items incolor_mappingshould correspond to the unique items incolor_variable. IfNULL, then the defaultcolor_mappingspecified in the count table will be used. DefaultNULL.- text_size
Size of axis text. Default
10.- show_x_labels
If
TRUE, the labels for the mutation types on the x-axis will be shown. DefaultTRUE.- show_y_labels
If
TRUE, the y-axis ticks and labels will be shown. DefaultTRUE.- same_scale
If
TRUE, the scale of the probability for each signature will be the same. IfFALSE, then the scale of the y-axis will be adjusted for each signature. DefaultFALE.- y_max
Vector of maximum y-axis limits for each signature. One value may also be provided to specify a constant y-axis limit for all signatures. Vector length must be 1 or equivalent to the number of signatures. Default
NULL.- annotation
Vector of annotations to be displayed in the top right corner of each signature. Vector length must be equivalent to the number of signatures. Default
NULL.- percent
If
TRUE, the y-axis will be represented in percent format instead of mutation counts. DefaultTRUE.- plotly
If
TRUE, the the plot will be made interactive usingplotly. DefaultFALSE.
Examples
data(res)
plot_signatures(res, model_id = "res")