Calculate and produce a list of thresholded counts (on natural scale),
thresholds, bins, densities estimated on each bin, and the original data from
thresholdSCRNACountMatrix
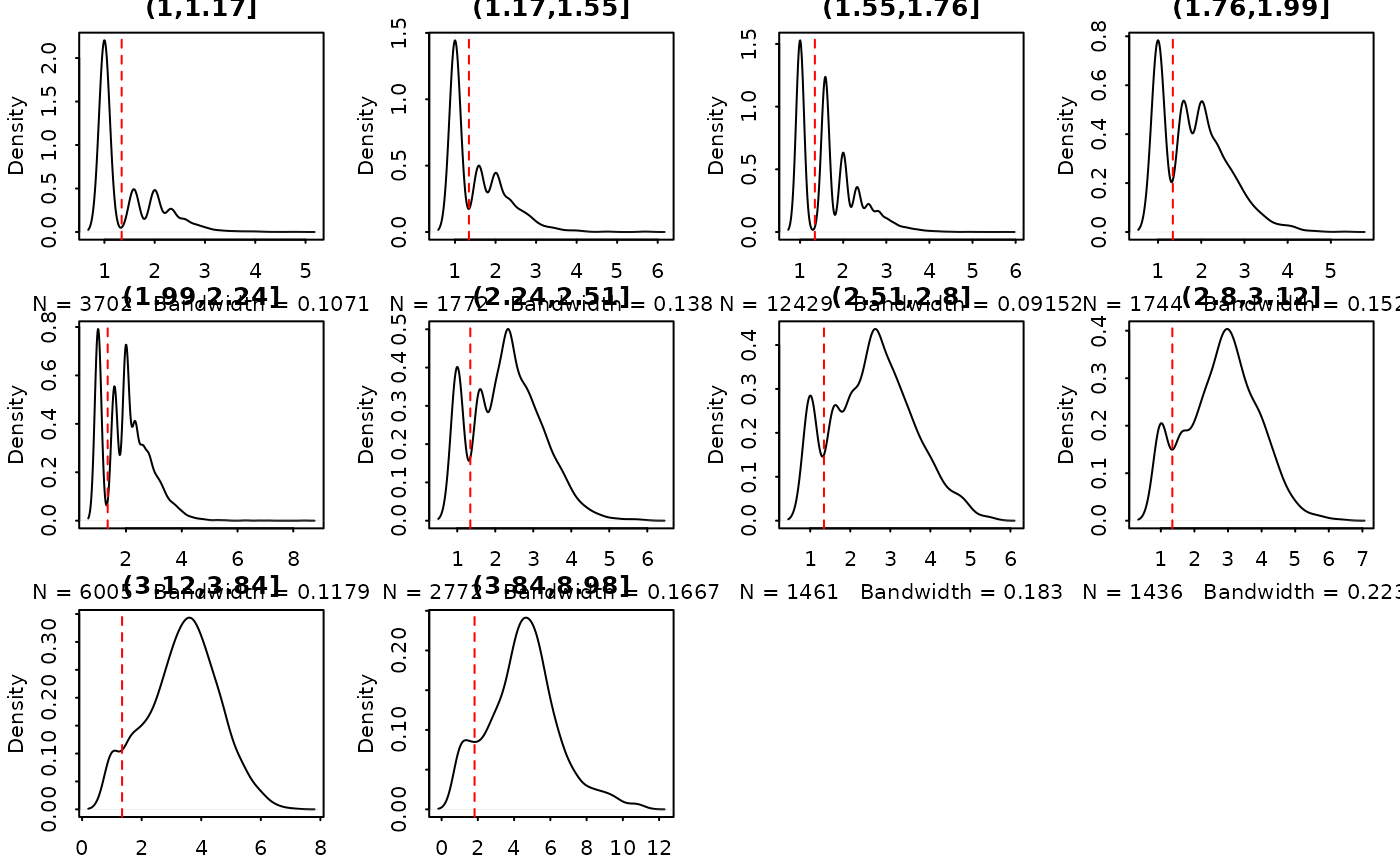
plotMASTThresholdGenes(
  inSCE,
  useAssay = "logcounts",
  doPlot = TRUE,
  isLogged = TRUE,
  check_sanity = TRUE
)
Arguments
- inSCE
SingleCellExperiment object
- useAssay
character, default
"logcounts"- doPlot
Logical scalar. Whether to directly plot in the plotting area. If
FALSE, will return a graphical object which can be visualized withgrid.draw(). DefaultTRUE.- isLogged
Logical scalar. Whether the assay used for the analysis is logged. If not, will do a
log(assay + 1)transformation. DefaultTRUE.- check_sanity
Logical scalar. Whether to perform MAST's sanity check to see if the counts are logged. Default
TRUE
Value
Plot the thresholding onto the plotting region if plot == TRUE
or a graphical object if plot == FALSE.
Examples
data("mouseBrainSubsetSCE")
plotMASTThresholdGenes(mouseBrainSubsetSCE)
#> `fData` has no primerid.  I'll make something up.
#> `cData` has no wellKey.  I'll make something up.
#> Assuming data assay in position 1, with name et is log-transformed.
#> Warning: calling par(new=TRUE) with no plot