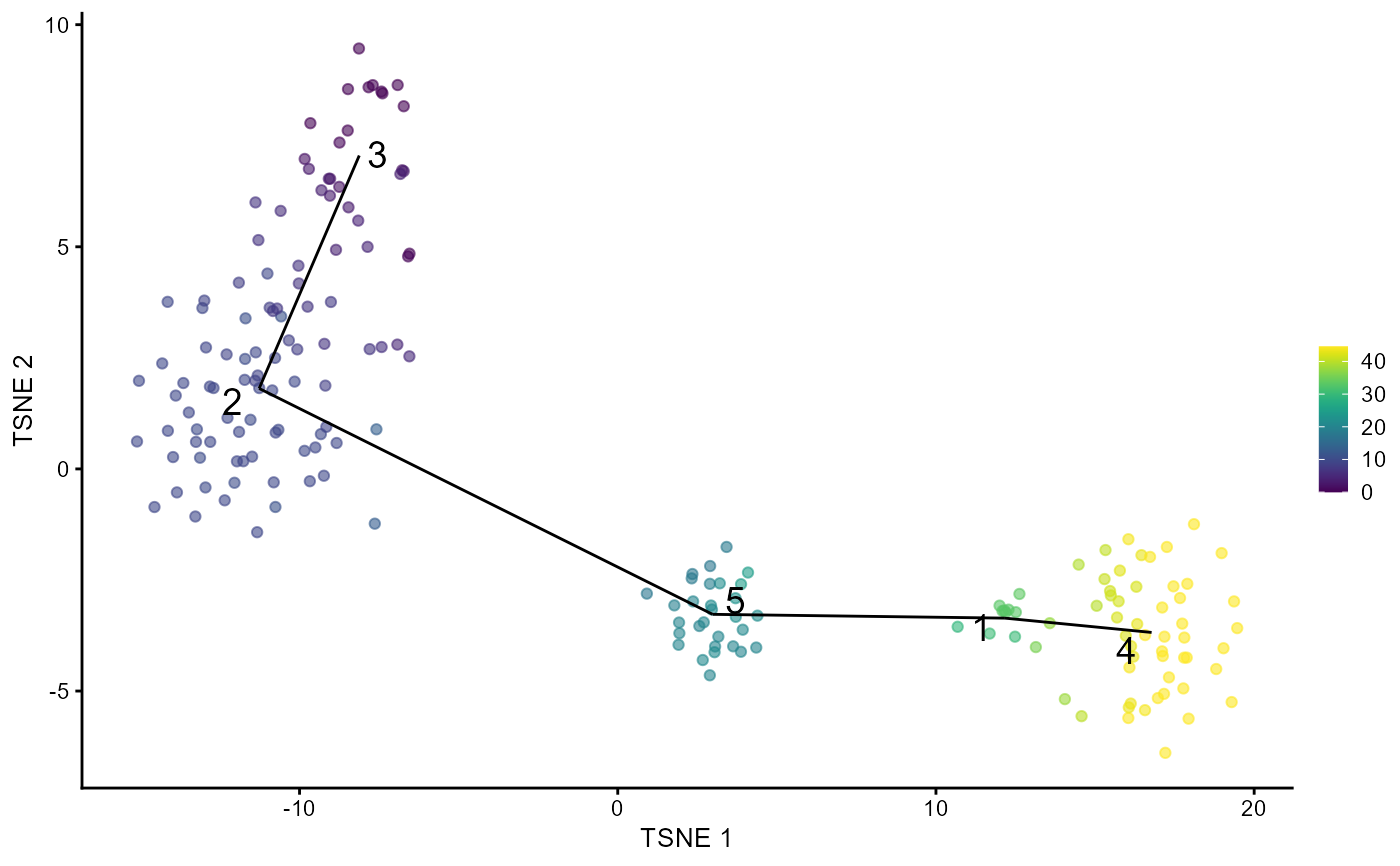
A wrapper function which visualizes outputs from the
runTSCAN function. Plots the pseudotime ordering of the cells
by projecting them onto the MST
plotTSCANResults(inSCE, useReducedDim)Arguments
- inSCE
Input SingleCellExperiment object.
- useReducedDim
Saved dimension reduction name in
inSCEobject. Required.
Value
A plot with the pseudotime ordering of the cells by projecting them onto the MST.
Examples
data("scExample", package = "singleCellTK")
sce <- subsetSCECols(sce, colData = "type != 'EmptyDroplet'")
rowData(sce)$Symbol <- rowData(sce)$feature_name
rownames(sce) <- rowData(sce)$Symbol
sce <- scaterlogNormCounts(sce, assayName = "logcounts")
sce <- runDimReduce(inSCE = sce, method = "scaterPCA",
                    useAssay = "logcounts", reducedDimName = "PCA")
#> Thu Apr 28 11:27:26 2022 ... Computing Scater PCA.
sce <- runDimReduce(inSCE = sce, method = "rTSNE", useReducedDim = "PCA",
                    reducedDimName = "TSNE")
#> Thu Apr 28 11:27:26 2022 ... Computing RtSNE.
#> Warning: using `useReducedDim`, `run_pca` and `ntop` forced to be FALSE/NULL
sce <- runTSCAN (inSCE = sce, useReducedDim = "PCA", seed = NULL)
#> Thu Apr 28 11:27:27 2022 ... Running 'scran SNN clustering'
#> Cluster involved in path 4 are: 1:5
#> Number of estimated paths is 1
plotTSCANResults(inSCE = sce, useReducedDim = "TSNE")