Run plotTSCANPseudotimeGenes function to plot genes with significant changes
Source:R/runTSCAN.R
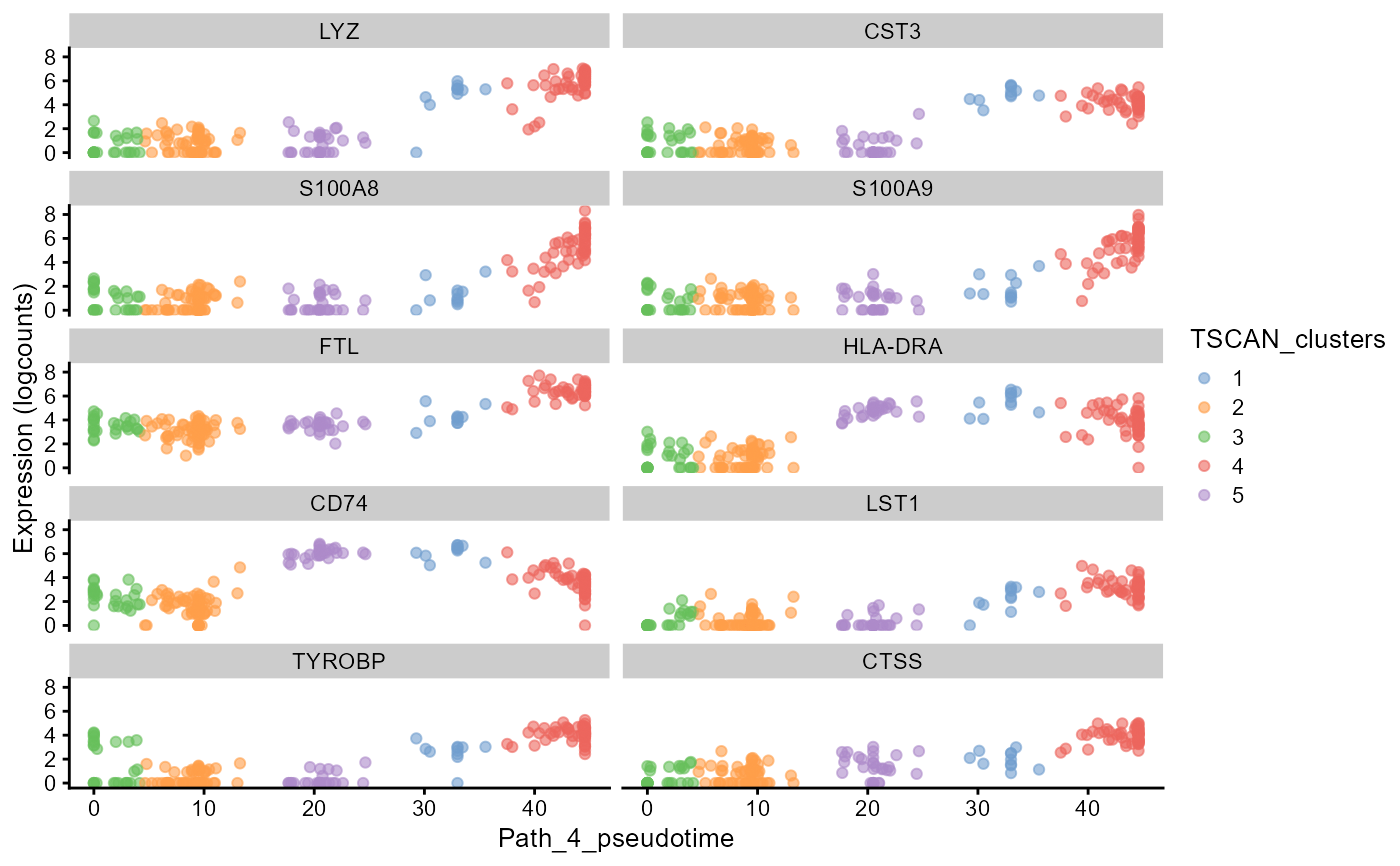
plotTSCANPseudotimeGenes.RdA wrapper function which visualizes outputs from the
runTSCANDEG function. Plots the genes that increase or decrease
in expression with increasing pseudotime along the path in the MST.
plotTSCANPseudotimeGenes(
  inSCE,
  pathIndex,
  direction = c("increasing", "decreasing"),
  n = 10
)
Arguments
- inSCE
Input SingleCellExperiment object.
- pathIndex
Path number for which the pseudotime values should be used. PathIndex corresponds to one path from the root node to one of the terminal nodes.
- direction
Which direction to use. Choices are increasing or decreasing.
- n
An integer. Only to plot this number of top genes that are increasing/decreasing in expression with increasing pseudotime along the path in the MST. Default
10.
Value
A plot with the top genes that increase/decrease in expression with increasing pseudotime along the path in the MST
Examples
data("scExample", package = "singleCellTK")
sce <- subsetSCECols(sce, colData = "type != 'EmptyDroplet'")
rowData(sce)$Symbol <- rowData(sce)$feature_name
rownames(sce) <- rowData(sce)$Symbol
sce <- scaterlogNormCounts(sce, assayName = "logcounts")
sce <- runDimReduce(inSCE = sce, method = "scaterPCA",
                    useAssay = "logcounts", reducedDimName = "PCA")
#> Thu Apr 28 11:27:10 2022 ... Computing Scater PCA.
sce <- runDimReduce(inSCE = sce, method = "rTSNE", useReducedDim = "PCA",
                    reducedDimName = "TSNE")
#> Thu Apr 28 11:27:10 2022 ... Computing RtSNE.
#> Warning: using `useReducedDim`, `run_pca` and `ntop` forced to be FALSE/NULL
sce <- runTSCAN (inSCE = sce, useReducedDim = "PCA", seed = NULL)
#> Thu Apr 28 11:27:11 2022 ... Running 'scran SNN clustering'
#> Cluster involved in path 4 are: 1:5
#> Number of estimated paths is 1
sce <- runTSCANDEG(inSCE = sce, pathIndex = 4)
plotTSCANPseudotimeGenes(inSCE = sce, pathIndex = 4,
                         direction = "increasing")