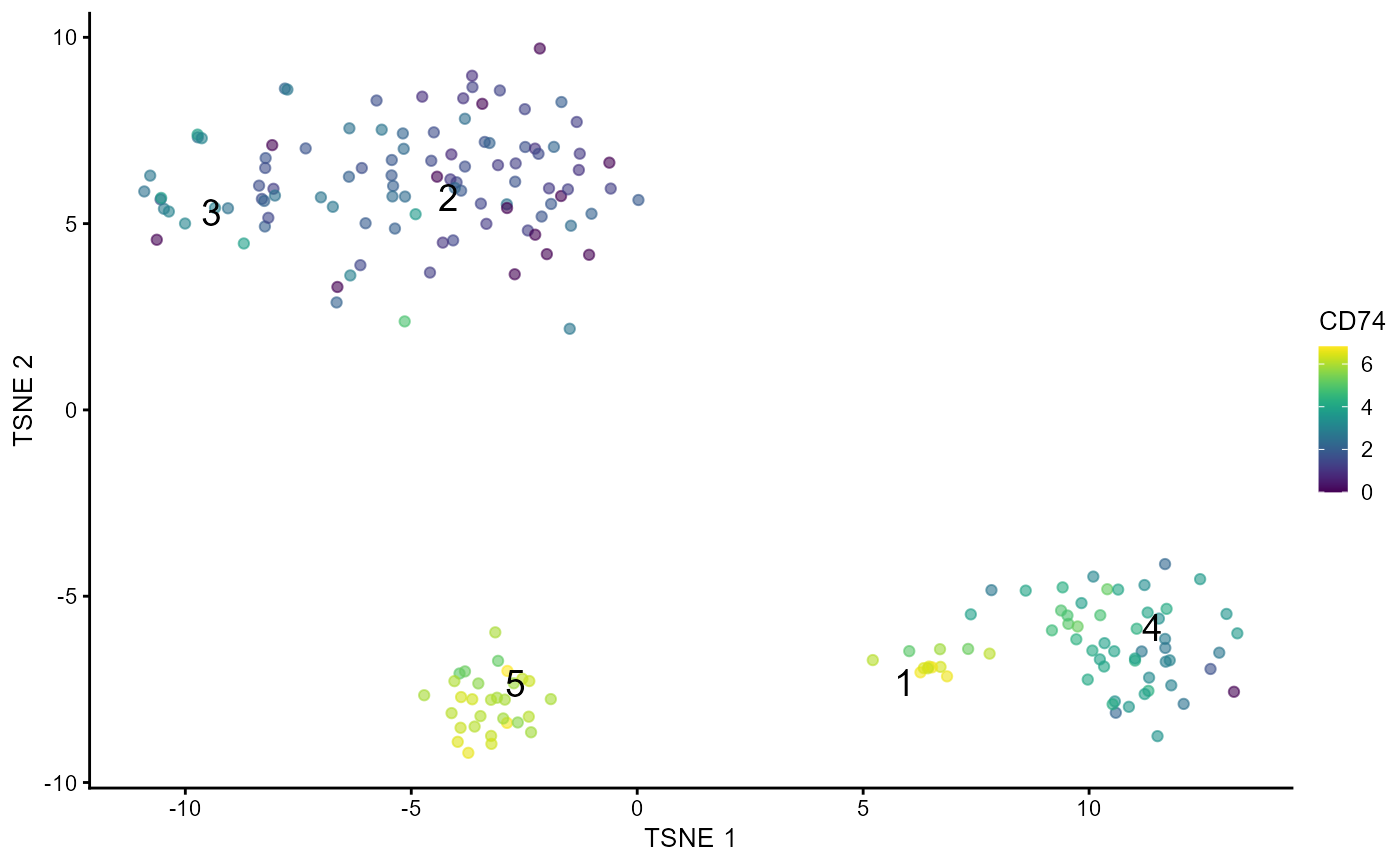
Run plotTSCANDEgenes function to plot cells colored by the expression of a gene of interest
Source:R/runTSCAN.R
plotTSCANDEgenes.RdA wrapper function which plots all the cells in the cluster containing the branch point of the MST in the dataset. Each point is a cell colored by the expression of a gene of interest and the relevant edges of the MST are overlaid on top.
plotTSCANDEgenes(inSCE, geneSymbol, useClusters = NULL, useReducedDim)Arguments
- inSCE
Input SingleCellExperiment object.
- geneSymbol
Choose the gene of interest from the DE genes in order to know the level of expression of gene in clusters.
- useClusters
Choose the cluster containing the branch point in the data in order to recompute the pseudotimes so that the root lies at the cluster center, allowing us to detect genes that are associated with the divergence of the branches.
- useReducedDim
Saved dimension reduction name in
inSCE. Required.
Value
A plots with the cells colored by the expression of a gene of interest.
Examples
data("scExample", package = "singleCellTK")
sce <- subsetSCECols(sce, colData = "type != 'EmptyDroplet'")
rowData(sce)$Symbol <- rowData(sce)$feature_name
rownames(sce) <- rowData(sce)$Symbol
sce <- scaterlogNormCounts(sce, assayName = "logcounts")
sce <- runDimReduce(inSCE = sce, method = "scaterPCA",
                    useAssay = "logcounts", reducedDimName = "PCA")
#> Thu Apr 28 11:27:07 2022 ... Computing Scater PCA.
sce <- runDimReduce(inSCE = sce, method = "rTSNE", useReducedDim = "PCA",
                    reducedDimName = "TSNE")
#> Thu Apr 28 11:27:08 2022 ... Computing RtSNE.
#> Warning: using `useReducedDim`, `run_pca` and `ntop` forced to be FALSE/NULL
sce <- runTSCAN (inSCE = sce, useReducedDim = "PCA", seed = NULL)
#> Thu Apr 28 11:27:08 2022 ... Running 'scran SNN clustering'
#> Found more than one class "dist" in cache; using the first, from namespace 'BiocGenerics'
#> Also defined by 'spam'
#> Found more than one class "dist" in cache; using the first, from namespace 'BiocGenerics'
#> Also defined by 'spam'
#> Cluster involved in path 4 are: 1:5
#> Number of estimated paths is 1
sce <- runTSCANDEG(inSCE = sce, pathIndex = 4)
sce <- runTSCANClusterDEAnalysis(inSCE = sce, useClusters = 5)
#> Clusters involved in path 4 are: c(1, 4, 5)
#> Clusters involved in path 3 are: c(2, 3, 5)
#> Number of estimated paths of cluster 5 is 2. Following are the terminal nodes for each path respectively: c("4", "3")
plotTSCANDEgenes(inSCE = sce, geneSymbol = "CD74", useReducedDim = "TSNE")
