Plot results of reduced dimensions data and colors by annotation data stored in the colData slot.
plotSCEDimReduceColData(
  inSCE,
  colorBy,
  reducedDimName,
  sample = NULL,
  groupBy = NULL,
  conditionClass = NULL,
  shape = NULL,
  xlab = NULL,
  ylab = NULL,
  baseSize = 12,
  axisSize = NULL,
  axisLabelSize = NULL,
  dim1 = NULL,
  dim2 = NULL,
  bin = NULL,
  binLabel = NULL,
  dotSize = 0.5,
  transparency = 1,
  colorScale = NULL,
  colorLow = "white",
  colorMid = "gray",
  colorHigh = "blue",
  defaultTheme = TRUE,
  title = NULL,
  titleSize = 15,
  labelClusters = TRUE,
  clusterLabelSize = 3.5,
  legendTitle = NULL,
  legendTitleSize = NULL,
  legendSize = NULL,
  combinePlot = "none",
  plotLabels = NULL
)
Arguments
- inSCE
Input SingleCellExperiment object with saved dimension reduction components or a variable with saved results. Required.
- colorBy
Color by a condition(any column of the annotation data). Required.
- reducedDimName
Saved dimension reduction matrix name in the SingleCellExperiment object. Required.
- sample
Character vector. Indicates which sample each cell belongs to.
- groupBy
Group by a condition(any column of the annotation data). Default NULL.
- conditionClass
Class of the annotation data used in colorBy. Options are NULL, "factor" or "numeric". If NULL, class will default to the original class. Default NULL.
- shape
Add shapes to each condition.
- xlab
Character vector. Label for x-axis. Default NULL.
- ylab
Character vector. Label for y-axis. Default NULL.
- baseSize
The base font size for all text. Default 12. Can be overwritten by titleSize, axisSize, and axisLabelSize, legendSize, legendTitleSize.
- axisSize
Size of x/y-axis ticks. Default NULL.
- axisLabelSize
Size of x/y-axis labels. Default NULL.
- dim1
1st dimension to be used for plotting. Can either be a string which specifies the name of the dimension to be plotted from reducedDims, or a numeric value which specifies the index of the dimension to be plotted. Default is NULL.
- dim2
2nd dimension to be used for plotting. Can either be a string which specifies the name of the dimension to be plotted from reducedDims, or a numeric value which specifies the index of the dimension to be plotted. Default is NULL.
- bin
Numeric vector. If single value, will divide the numeric values into the `bin` groups. If more than one value, will bin numeric values using values as a cut point.
- binLabel
Character vector. Labels for the bins created by the `bin` parameter. Default NULL.
- dotSize
Size of dots. Default 0.5.
- transparency
Transparency of the dots, values will be 0-1. Default 1.
- colorScale
Vector. Needs to be same length as the number of unique levels of colorBy. Will be used only if conditionClass = "factor" or "character". Default NULL.
- colorLow
Character. A color available from `colors()`. The color will be used to signify the lowest values on the scale. Default 'white'.
- colorMid
Character. A color available from `colors()`. The color will be used to signify the midpoint on the scale. Default 'gray'.
- colorHigh
Character. A color available from `colors()`. The color will be used to signify the highest values on the scale. Default 'blue'.
- defaultTheme
adds grid to plot when TRUE. Default TRUE.
- title
Title of plot. Default NULL.
- titleSize
Size of title of plot. Default 15.
- labelClusters
Logical. Whether the cluster labels are plotted.
- clusterLabelSize
Numeric. Determines the size of cluster label when `labelClusters` is set to TRUE. Default 3.5.
- legendTitle
title of legend. Default NULL.
- legendTitleSize
size of legend title. Default 12.
- legendSize
size of legend. Default NULL. Default FALSE.
- combinePlot
Must be either "all", "sample", or "none". "all" will combine all plots into a single .ggplot object, while "sample" will output a list of plots separated by sample. Default "none".
- plotLabels
labels to each plot. If set to "default", will use the name of the samples as the labels. If set to "none", no label will be plotted.
Value
a ggplot of the reduced dimension plot of coldata.
Examples
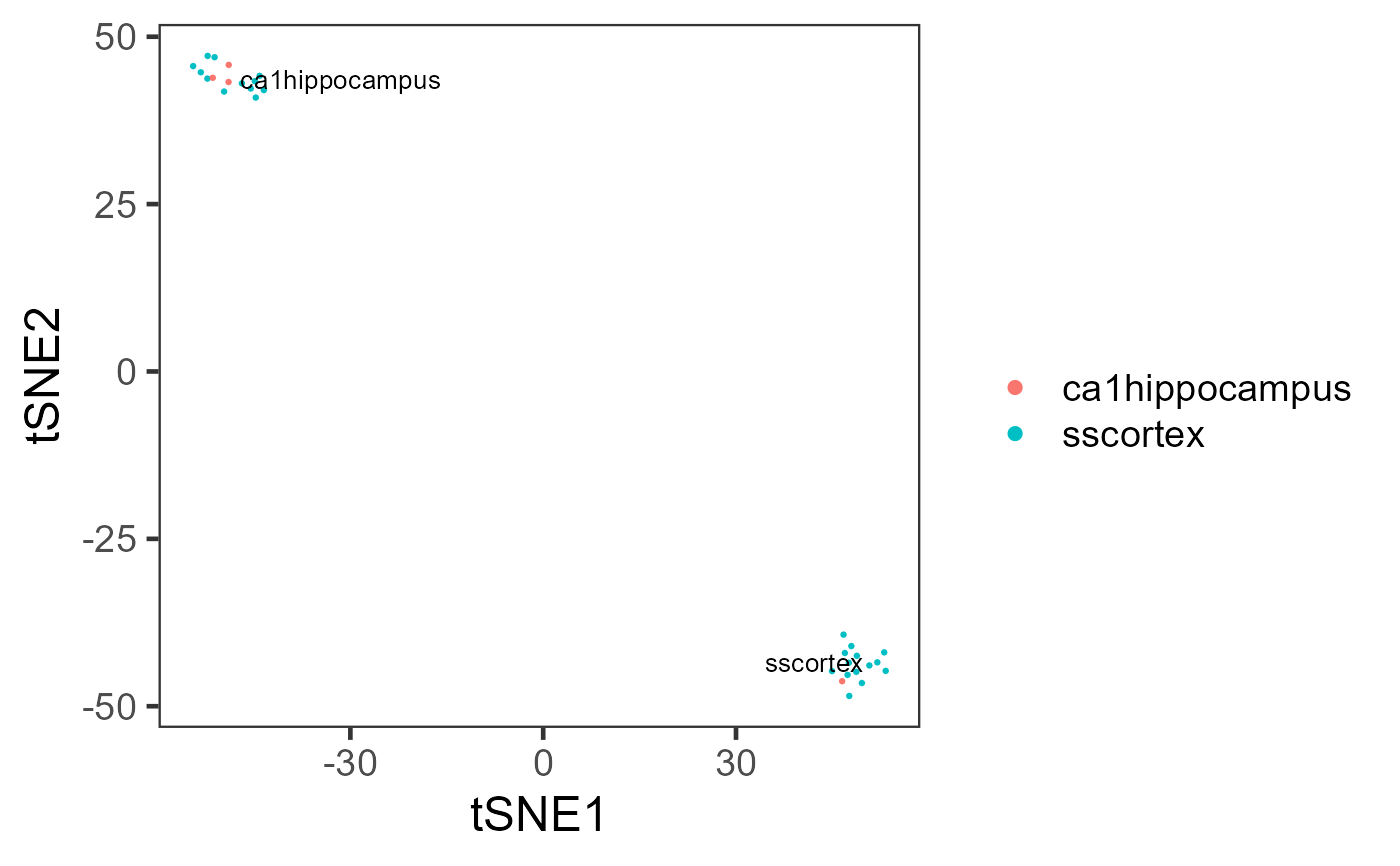
data("mouseBrainSubsetSCE")
plotSCEDimReduceColData(
inSCE = mouseBrainSubsetSCE, colorBy = "tissue",
shape = NULL, conditionClass = "factor",
reducedDimName = "TSNE_counts",
xlab = "tSNE1", ylab = "tSNE2", labelClusters = TRUE
)
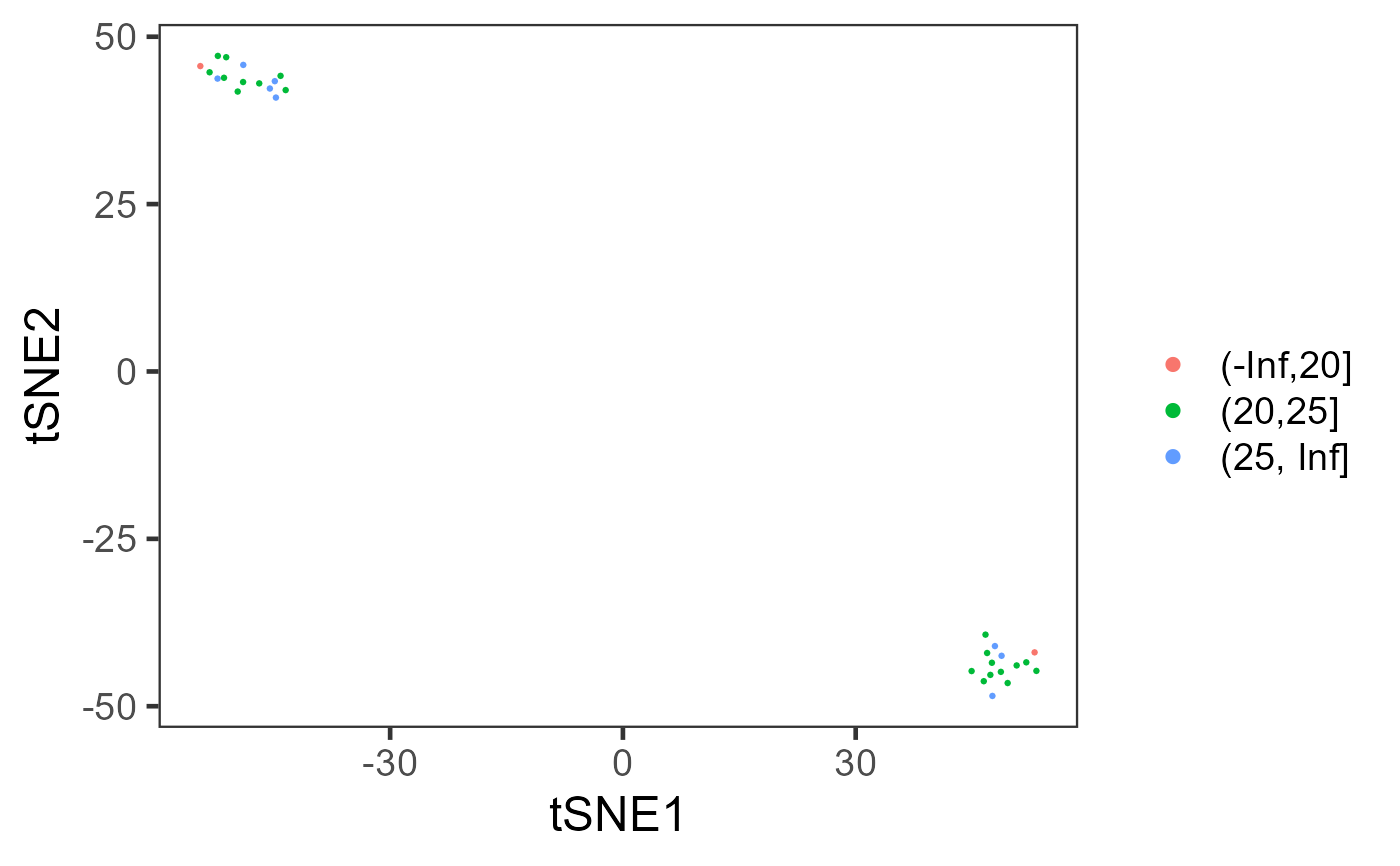
 plotSCEDimReduceColData(
inSCE = mouseBrainSubsetSCE, colorBy = "age",
shape = NULL, conditionClass = "numeric",
reducedDimName = "TSNE_counts", bin = c(-Inf, 20, 25, +Inf),
xlab = "tSNE1", ylab = "tSNE2", labelClusters = FALSE
)
plotSCEDimReduceColData(
inSCE = mouseBrainSubsetSCE, colorBy = "age",
shape = NULL, conditionClass = "numeric",
reducedDimName = "TSNE_counts", bin = c(-Inf, 20, 25, +Inf),
xlab = "tSNE1", ylab = "tSNE2", labelClusters = FALSE
)