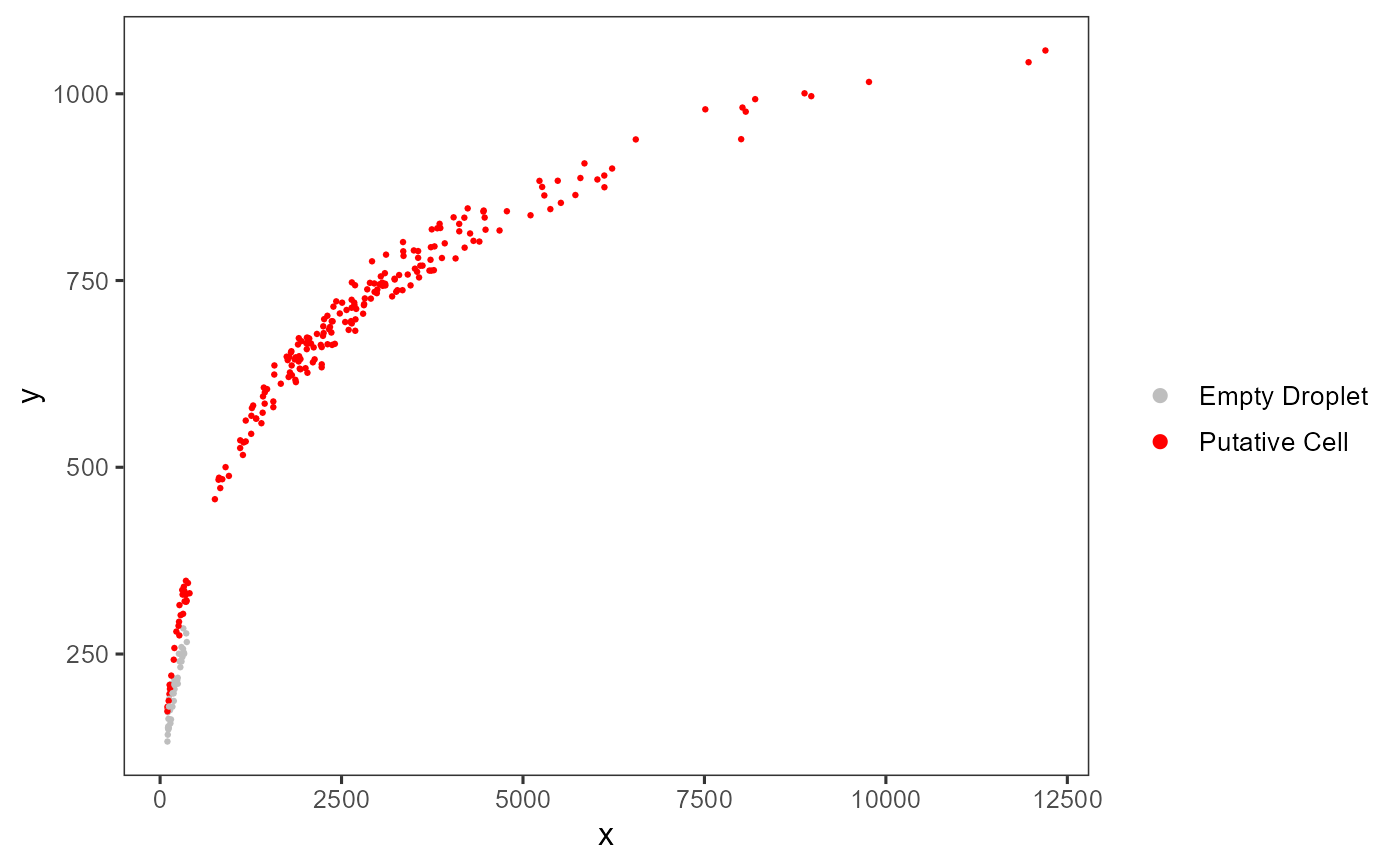
A plotting function which visualizes outputs from the runEmptyDrops function stored in the colData slot of the SingleCellExperiment object via scatterplot.
plotEmptyDropsScatter(
  inSCE,
  sample = NULL,
  fdrCutoff = 0.01,
  defaultTheme = TRUE,
  dotSize = 0.5,
  title = NULL,
  titleSize = 18,
  xlab = NULL,
  ylab = NULL,
  axisSize = 12,
  axisLabelSize = 15,
  legendTitle = NULL,
  legendTitleSize = 12,
  legendSize = 10,
  combinePlot = "none",
  relHeights = 1,
  relWidths = 1,
  samplePerColumn = TRUE,
  sampleRelHeights = 1,
  sampleRelWidths = 1
)
Arguments
- inSCE
Input SingleCellExperiment object with saved dimension reduction components or a variable with saved results from runEmptyDrops. Required.
- sample
Character vector. Indicates which sample each cell belongs to. Default NULL.
- fdrCutoff
Numeric. Thresholds barcodes based on the FDR values from runEmptyDrops as "Empty Droplet" or "Putative Cell". Default 0.01.
- defaultTheme
Removes grid in plot and sets axis title size to 10 when TRUE. Default TRUE.
- dotSize
Size of dots. Default 0.5.
- title
Title of plot. Default NULL.
- titleSize
Size of title of plot. Default 18.
- xlab
Character vector. Label for x-axis. Default NULL.
- ylab
Character vector. Label for y-axis. Default NULL.
- axisSize
Size of x/y-axis ticks. Default 12.
- axisLabelSize
Size of x/y-axis labels. Default 15.
- legendTitle
Title of legend. Default NULL.
- legendTitleSize
size of legend title. Default 12.
- legendSize
size of legend. Default 10.
- combinePlot
Boolean. If multiple plots are generated (multiple samples, etc.), will combined plots using `cowplot::plot_grid`. Default TRUE.
- relHeights
Relative heights of plots when combine is set.
- relWidths
Relative widths of plots when combine is set.
- samplePerColumn
If TRUE, when there are multiple samples and combining by "all", the output .ggplot will have plots from each sample on a single column. Default TRUE.
- sampleRelHeights
If there are multiple samples and combining by "all", the relative heights for each plot.
- sampleRelWidths
If there are multiple samples and combining by "all", the relative widths for each plot.
Value
a ggplot object of the scatter plot.
Examples
data(scExample, package="singleCellTK")
sce <- runEmptyDrops(inSCE=sce)
#> Thu Apr 28 11:26:16 2022 ... Running 'emptyDrops'
plotEmptyDropsScatter(inSCE=sce)