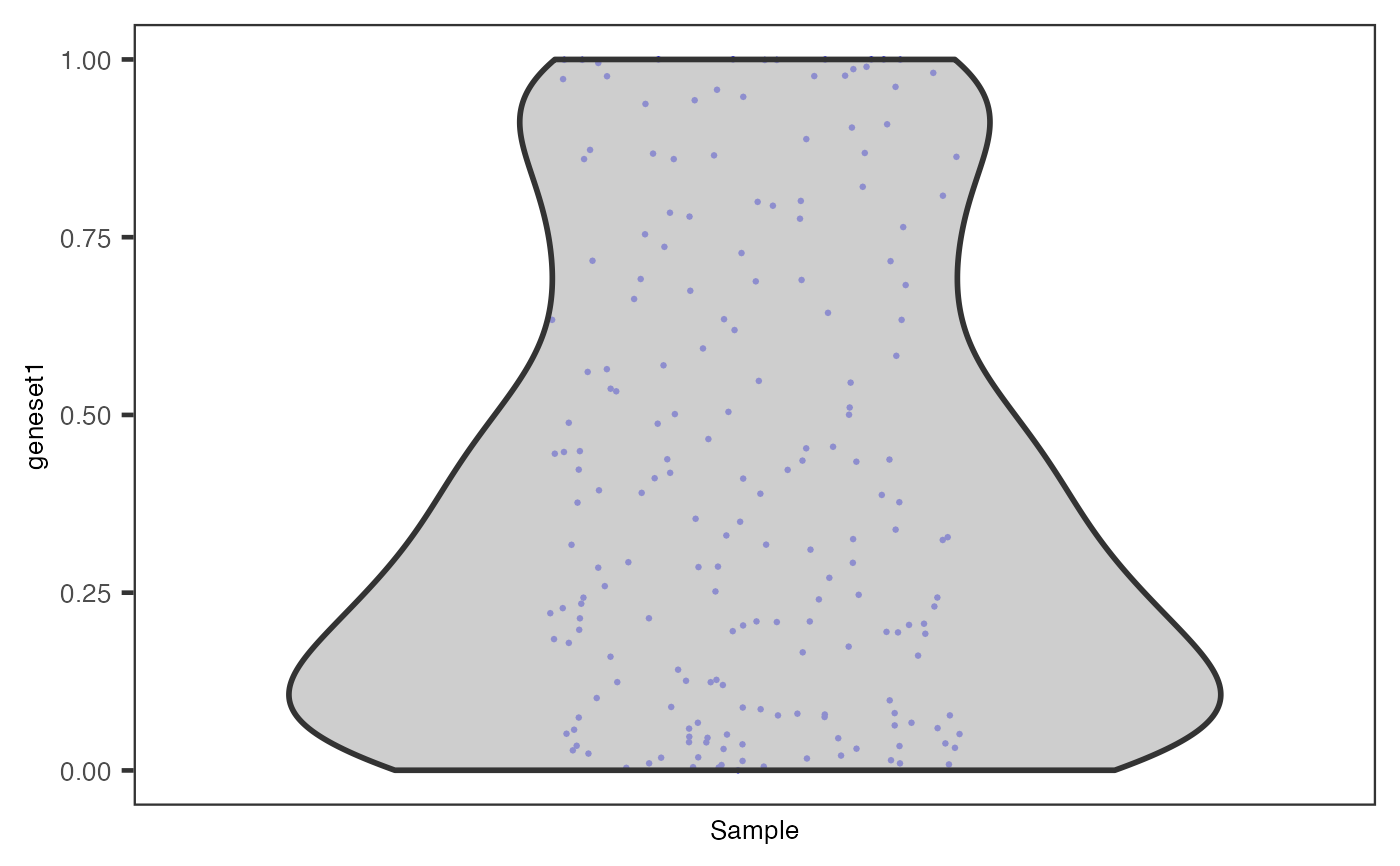
Generate violin plots for pathway analysis results
plotPathway(inSCE, resultName, geneset, groupby = NULL, boxplot = FALSE)
Arguments
| inSCE | Input SingleCellExperiment object. With
|
|---|---|
| resultName | A single character of the name of a score matrix, which
should be found in |
| geneset | A single character specifying the geneset of interest. Should be found in the geneSetCollection used for performing the analysis. |
| groupby | Either a single character specifying a column of
|
| boxplot | Whether to add a boxplot. Default |
Value
A ggplot object for the violin plot
Details
runGSVA() or runVAM() should be applied in advance of
using this function. Users can group the data by specifying groupby.
Examples
data("scExample", package = "singleCellTK") sce <- subsetSCECols(sce, colData = "type != 'EmptyDroplet'") sce <- scaterlogNormCounts(sce, assayName = "logcounts") gs1 <- rownames(sce)[seq(10)] gs2 <- rownames(sce)[seq(11,20)] gs <- list("geneset1" = gs1, "geneset2" = gs2) sce <- importGeneSetsFromList(inSCE = sce, geneSetList = gs, by = "rownames") sce <- runVAM(inSCE = sce, geneSetCollectionName = "GeneSetCollection", useAssay = "logcounts")#>#>plotPathway(sce, "VAM_GeneSetCollection_CDF", "geneset1")