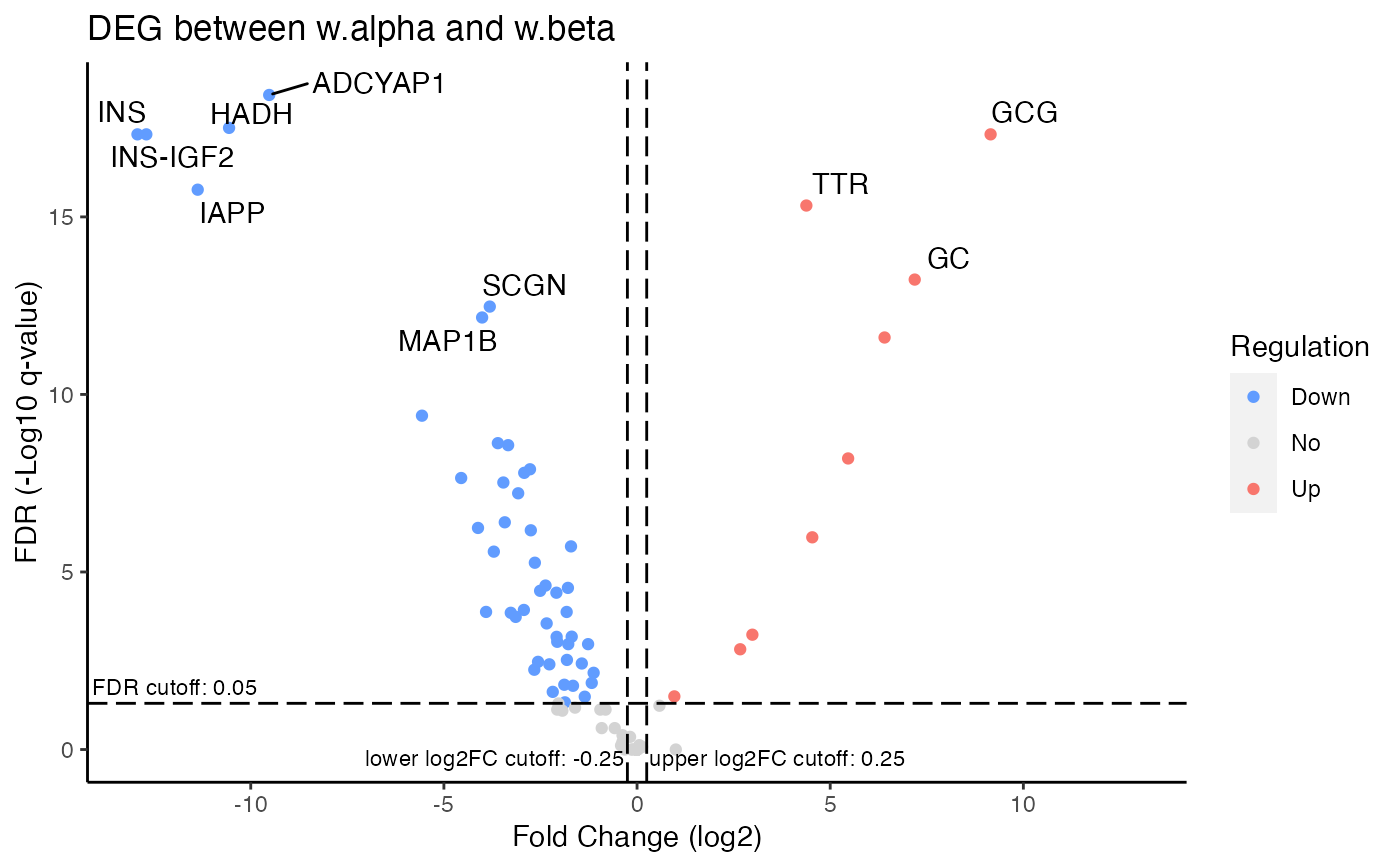
Generate volcano plot for DEGs
plotDEGVolcano(
  inSCE,
  useResult,
  labelTopN = 10,
  log2fcThreshold = 0.25,
  fdrThreshold = 0.05
)
Arguments
| inSCE | SingleCellExperiment inherited object. |
|---|---|
| useResult | character. A string specifying the |
| labelTopN | Integer, label this number of top DEGs that pass the filters. |
| log2fcThreshold | numeric. Label genes with the absolute values of
log2FC greater than this value as regulated. Default |
| fdrThreshold | numeric. Label genes with FDR value less than this
value as regulated. Default |
Value
A ggplot object of volcano plot
Details
Any of the differential expression analysis method from SCTK should be performed prior to using this function to generate volcano plots.
Examples
data("sceBatches")
sceBatches <- scaterlogNormCounts(sceBatches, "logcounts")
sce.w <- subsetSCECols(sceBatches, colData = "batch == 'w'")
sce.w <- runWilcox(sce.w, class = "cell_type", classGroup1 = "alpha",
                   groupName1 = "w.alpha", groupName2 = "w.beta",
                   analysisName = "w.aVSb")
plotDEGVolcano(sce.w, "w.aVSb")