Plot the differential Abundance
plotClusterAbundance(inSCE, cluster, variable, combinePlot = c("all", "none"))Arguments
- inSCE
A
SingleCellExperimentobject.- cluster
A single
character, specifying the name to store the cluster label incolData.- variable
A single
character, specifying the name to store the phenotype labels incolData.- combinePlot
Must be either "all" or "none". "all" will combine all plots into a single
ggplotobject. Default"all".
Value
When combinePlot = "none", a list with 4
ggplot objects; when combinePlot = "all", a
single ggplot object with for subplots.
Details
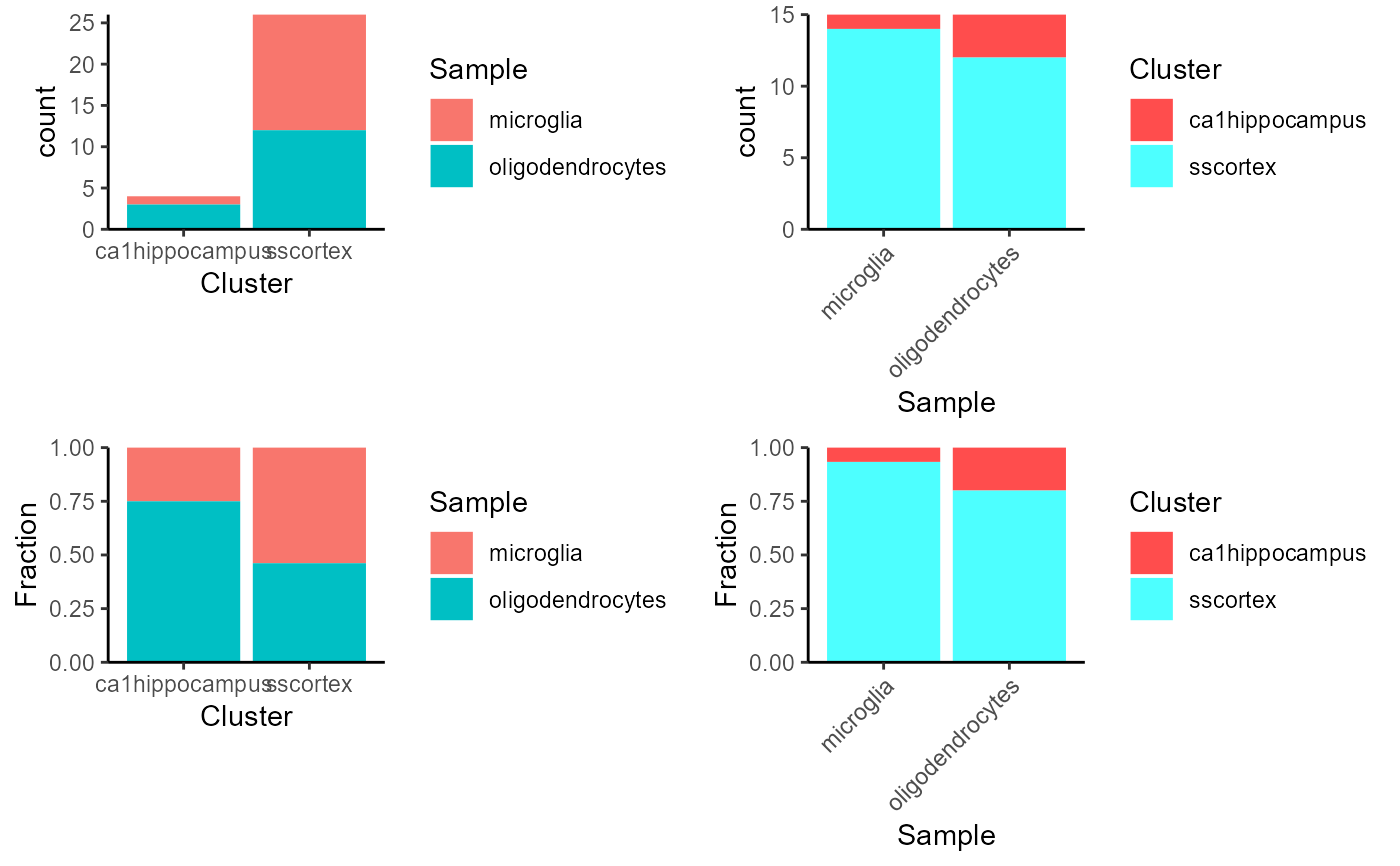
This function will visualize the differential abundance in two given variables, by making bar plots that presents the cell counting and fraction in different cases.
Examples
data("mouseBrainSubsetSCE", package = "singleCellTK")
plotClusterAbundance(inSCE = mouseBrainSubsetSCE,
                     cluster = "tissue",
                     variable = "level1class")