Plotting Celda module probability on a dimension reduction plot
Source:R/plot_dr.R
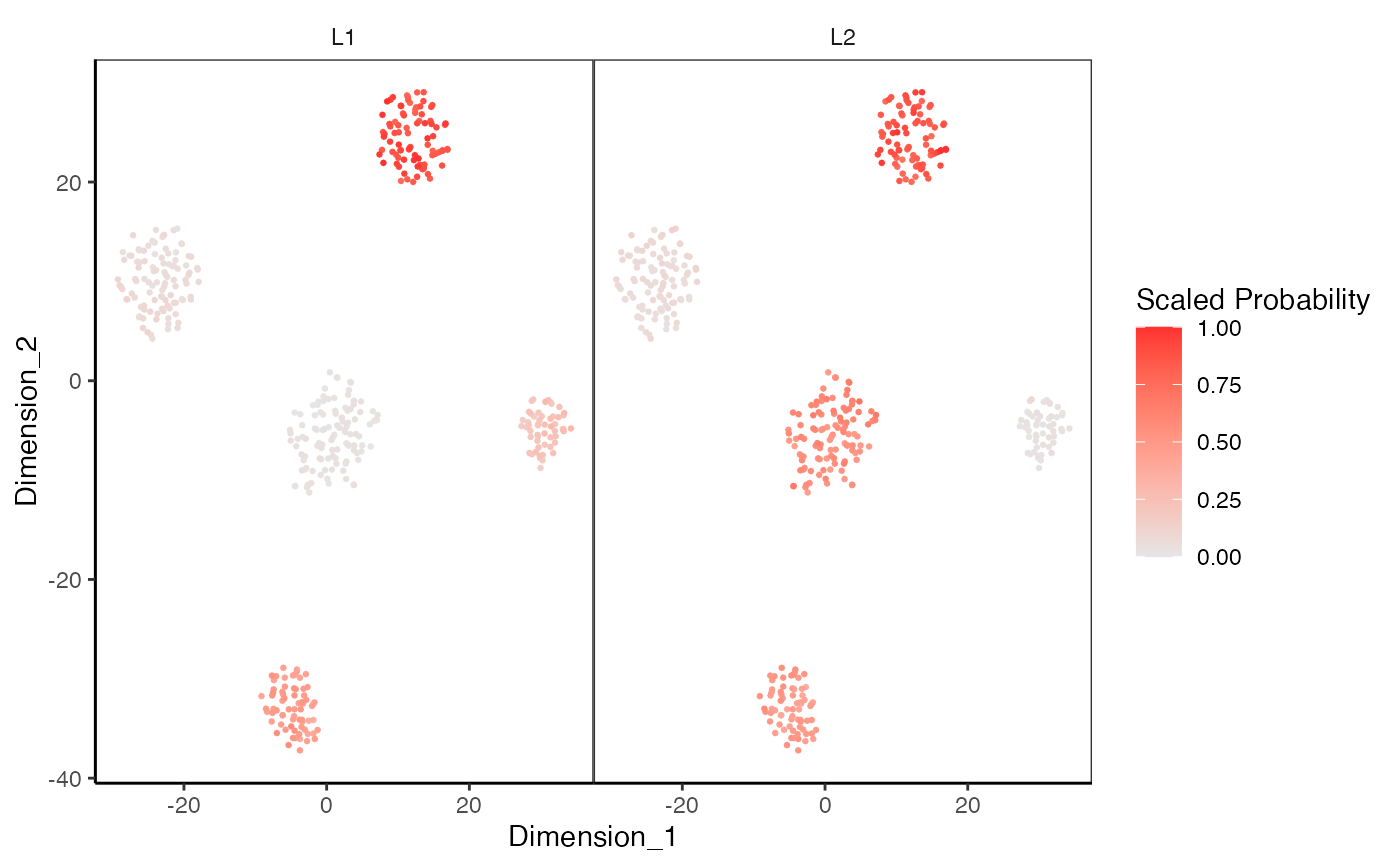
plotDimReduceModule.RdCreate a scatterplot for each row of a normalized gene expression matrix where x and y axis are from a data dimension reduction tool. The cells are colored by the module probability.
plotDimReduceModule(
  x,
  reducedDimName,
  useAssay = "counts",
  altExpName = "featureSubset",
  celdaMod,
  modules = NULL,
  dim1 = NULL,
  dim2 = NULL,
  size = 0.5,
  xlab = NULL,
  ylab = NULL,
  rescale = TRUE,
  limits = c(0, 1),
  colorLow = "grey90",
  colorHigh = "firebrick1",
  ncol = NULL,
  decreasing = FALSE
)

# S4 method for SingleCellExperiment
plotDimReduceModule(
  x,
  reducedDimName,
  useAssay = "counts",
  altExpName = "featureSubset",
  modules = NULL,
  dim1 = 1,
  dim2 = 2,
  size = 0.5,
  xlab = NULL,
  ylab = NULL,
  rescale = TRUE,
  limits = c(0, 1),
  colorLow = "grey90",
  colorHigh = "firebrick1",
  ncol = NULL,
  decreasing = FALSE
)

# S4 method for ANY
plotDimReduceModule(
  x,
  celdaMod,
  modules = NULL,
  dim1,
  dim2,
  size = 0.5,
  xlab = "Dimension_1",
  ylab = "Dimension_2",
  rescale = TRUE,
  limits = c(0, 1),
  colorLow = "grey90",
  colorHigh = "firebrick1",
  ncol = NULL,
  decreasing = FALSE
)
Arguments
| x | Numeric matrix or a SingleCellExperiment object
with the matrix located in the assay slot under |
|---|---|
| reducedDimName | The name of the dimension reduction slot in
|
| useAssay | A string specifying which assay
slot to use if |
| altExpName | The name for the altExp slot to use. Default "featureSubset". |
| celdaMod | Celda object of class "celda_G" or "celda_CG". Used only if
|
| modules | Character vector. Module(s) from celda model to be plotted. e.g. c("1", "2"). |
| dim1 | Integer or numeric vector. If |
| dim2 | Integer or numeric vector. If |
| size | Numeric. Sets size of point on plot. Default 0.5. |
| xlab | Character vector. Label for the x-axis. Default "Dimension_1". |
| ylab | Character vector. Label for the y-axis. Default "Dimension_2". |
| rescale | Logical. Whether rows of the matrix should be rescaled to [0, 1]. Default TRUE. |
| limits | Passed to scale_colour_gradient. The range of color scale. |
| colorLow | Character. A color available from `colors()`. The color will be used to signify the lowest values on the scale. |
| colorHigh | Character. A color available from `colors()`. The color will be used to signify the highest values on the scale. |
| ncol | Integer. Passed to facet_wrap. Specify the number of columns for facet wrap. |
| decreasing | logical. Specifies the order of plotting the points.
If |
Value
The plot as a ggplot object
Examples
data(sceCeldaCG) sce <- celdaTsne(sceCeldaCG) plotDimReduceModule(x = sce, reducedDimName = "celda_tSNE", modules = c("1", "2"))library(SingleCellExperiment) data(sceCeldaCG, celdaCGMod) sce <- celdaTsne(sceCeldaCG) plotDimReduceModule(x = counts(sce), dim1 = reducedDim(altExp(sce), "celda_tSNE")[, 1], dim2 = reducedDim(altExp(sce), "celda_tSNE")[, 2], celdaMod = celdaCGMod, modules = c("1", "2"))