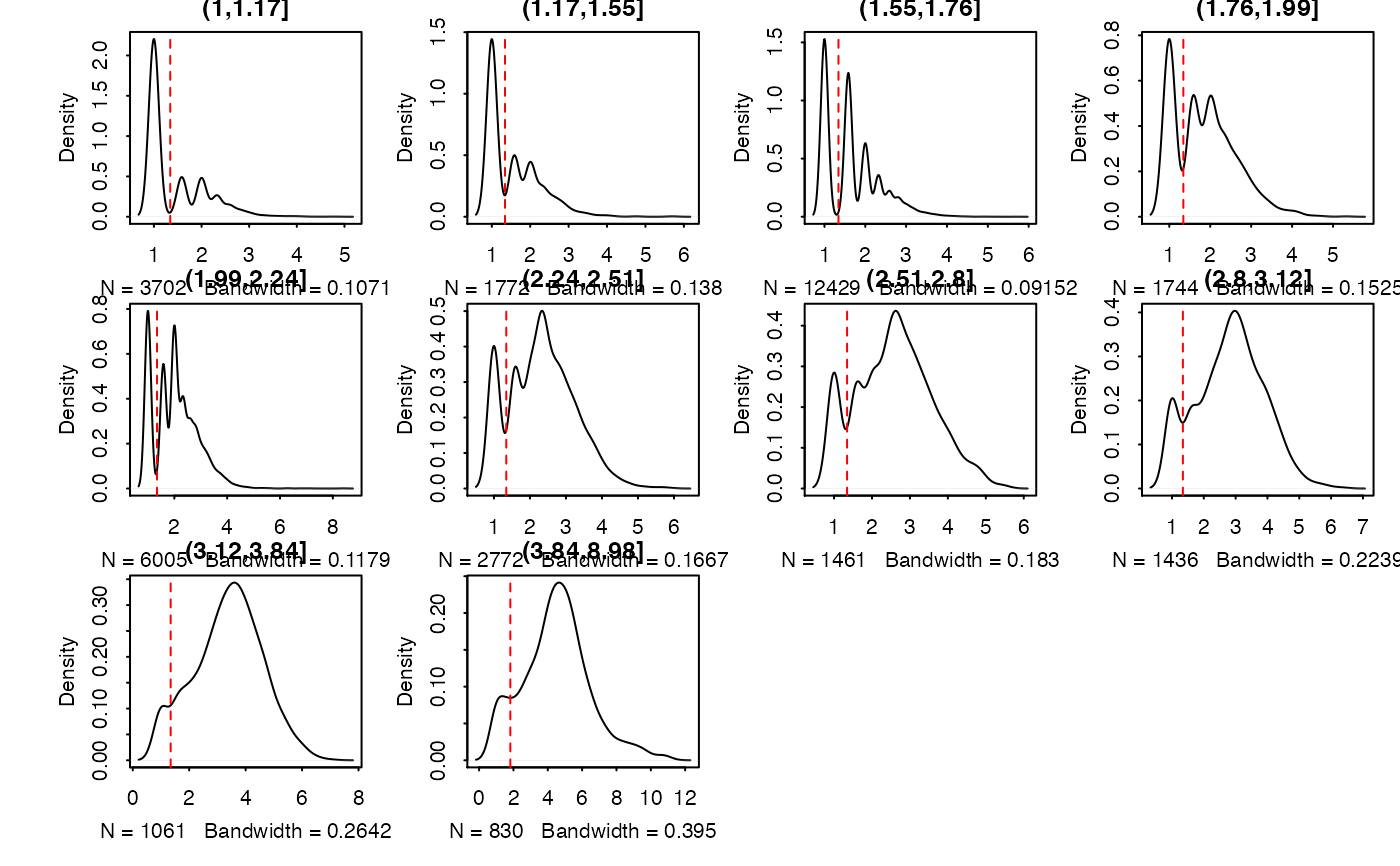
Calculate and produce a list of thresholded counts (on natural scale),
thresholds, bins, densities estimated on each bin, and the original data from
thresholdSCRNACountMatrix
plotMASTThresholdGenes(
  inSCE,
  useAssay = "logcounts",
  doPlot = TRUE,
  isLogged = TRUE,
  check_sanity = TRUE
)
Arguments
| inSCE | SingleCellExperiment object |
|---|---|
| useAssay | character, default |
| doPlot | Logical scalar. Whether to directly plot in the plotting area.
If |
| isLogged | Logical scalar. Whether the assay used for the analysis is
logged. If not, will do a |
| check_sanity | Logical scalar. Whether to perform MAST's sanity check
to see if the counts are logged. Default |
Value
Plot the thresholding onto the plotting region if plot == TRUE
or a graphical object if plot == FALSE.
Examples
#>#>#>#> Warning: calling par(new=TRUE) with no plot