Plot the differential Abundance
plotClusterAbundance(inSCE, cluster, variable)
Arguments
| inSCE | A |
|---|---|
| cluster | A single |
| variable | A single |
Value
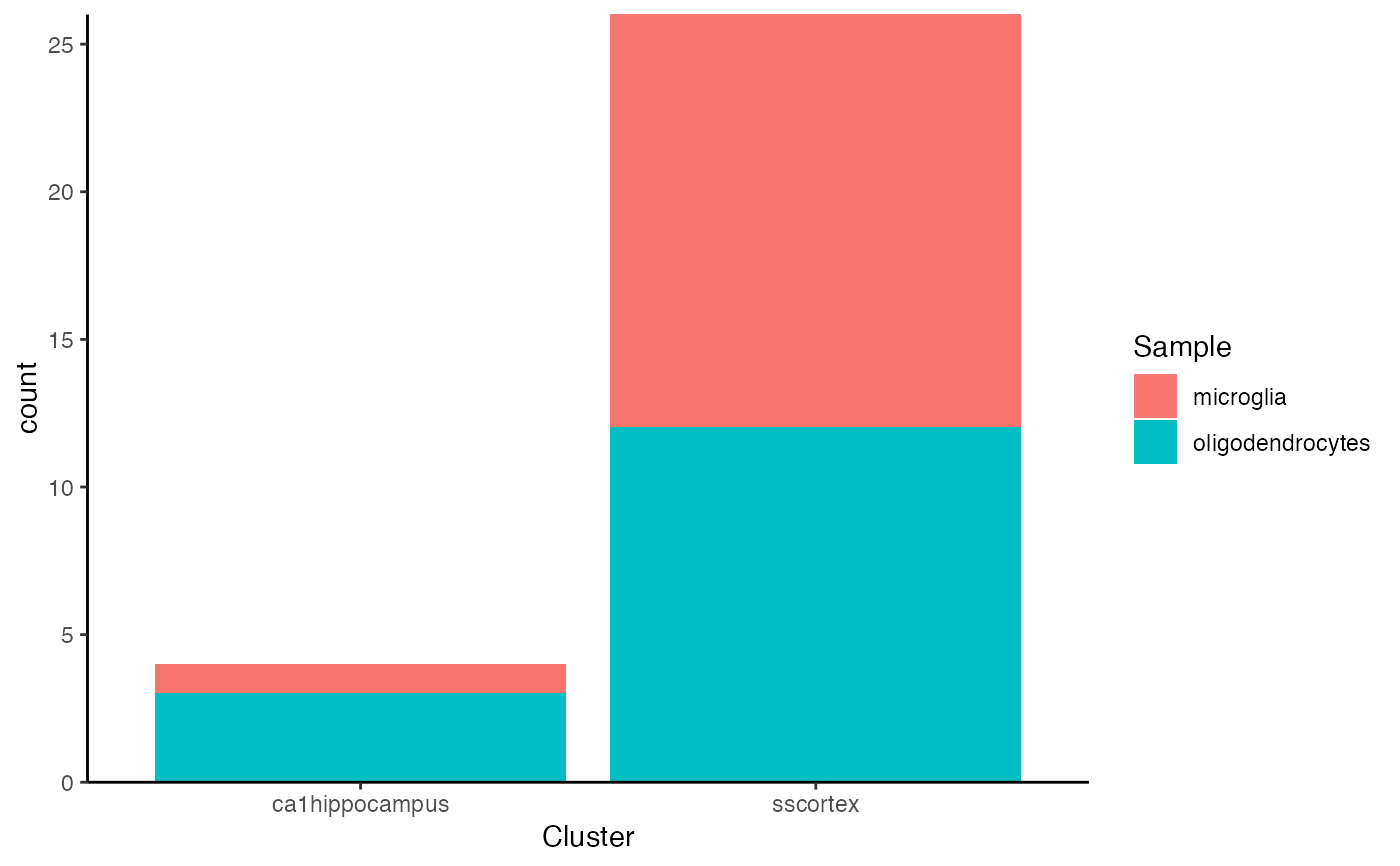
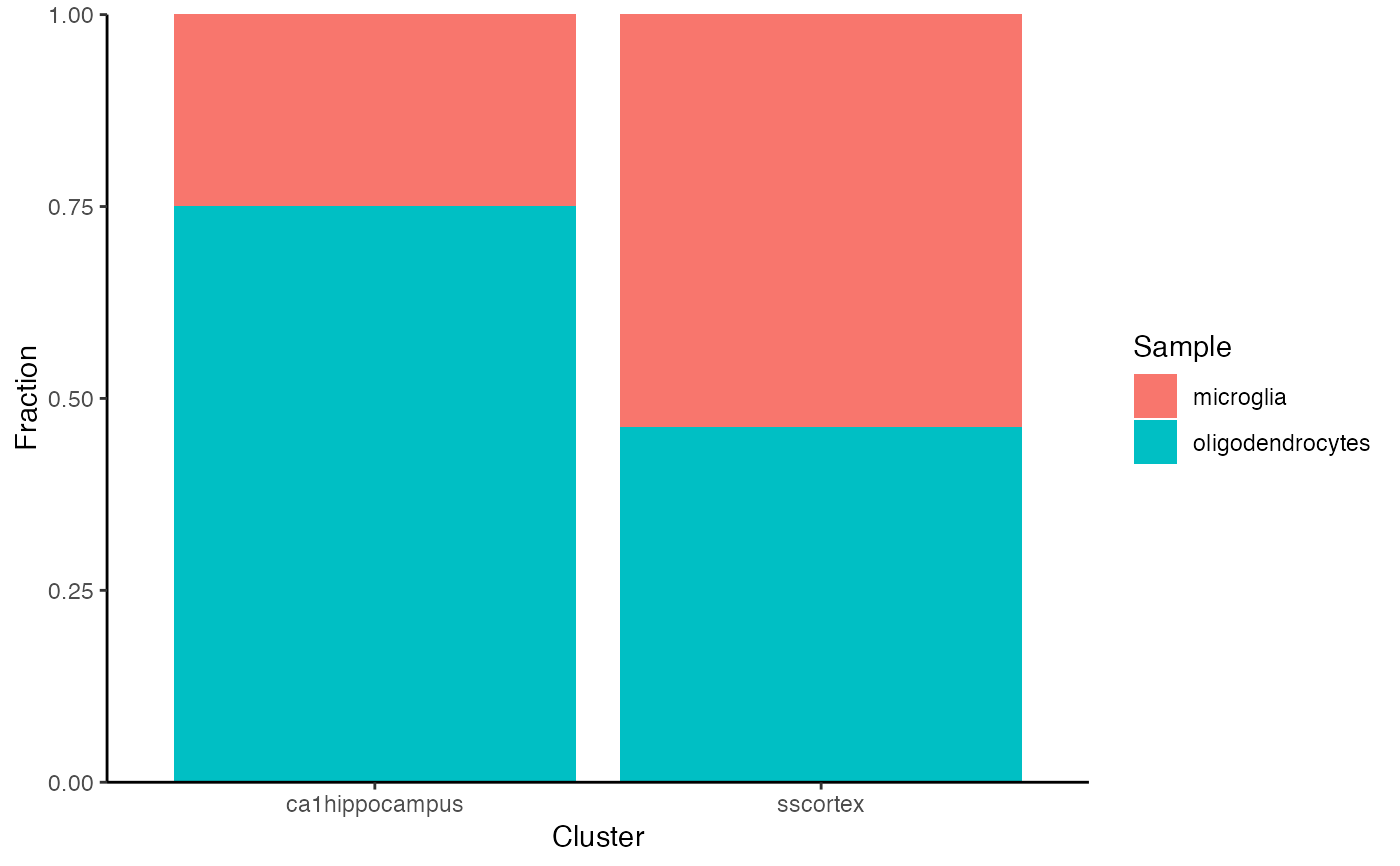
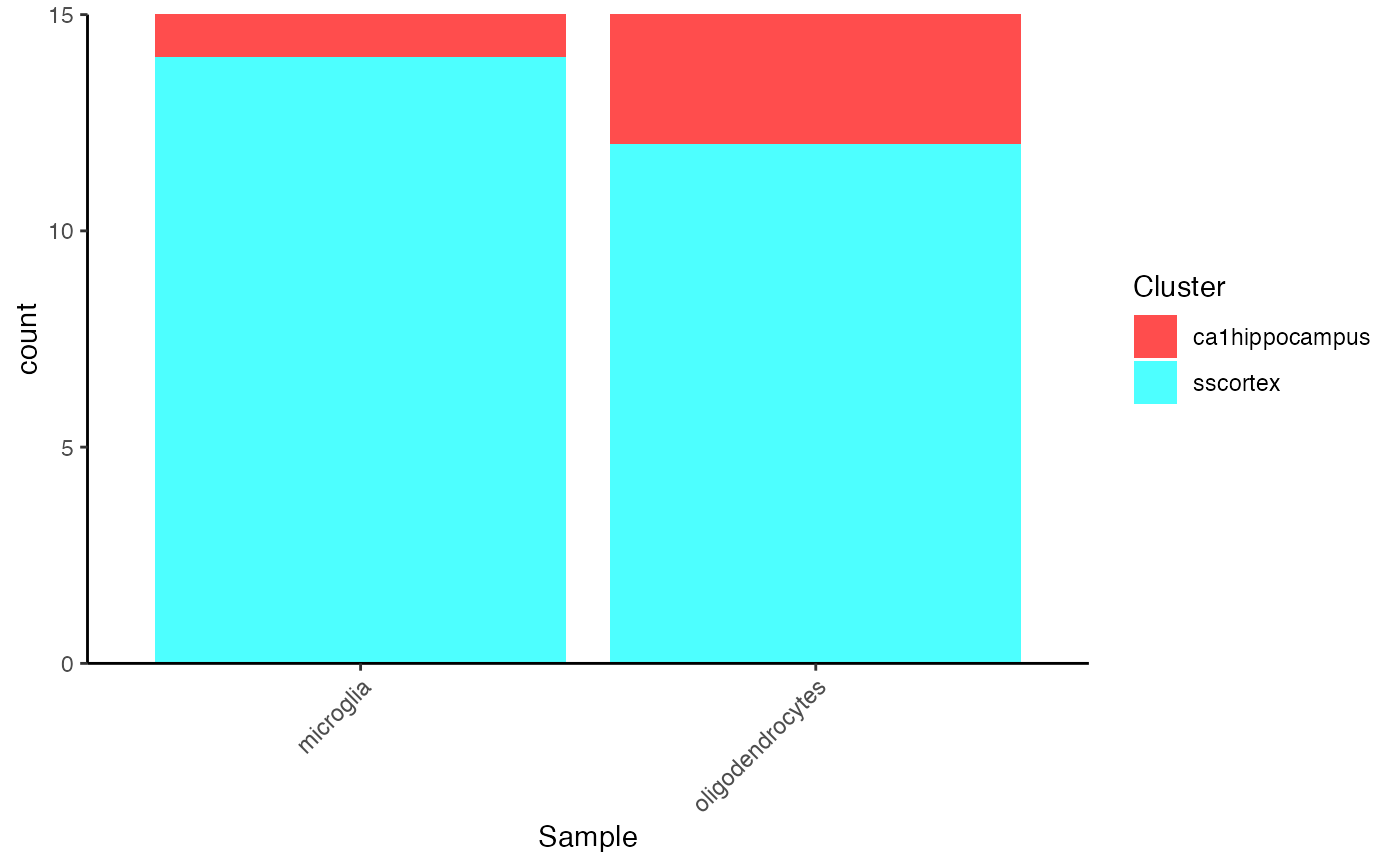
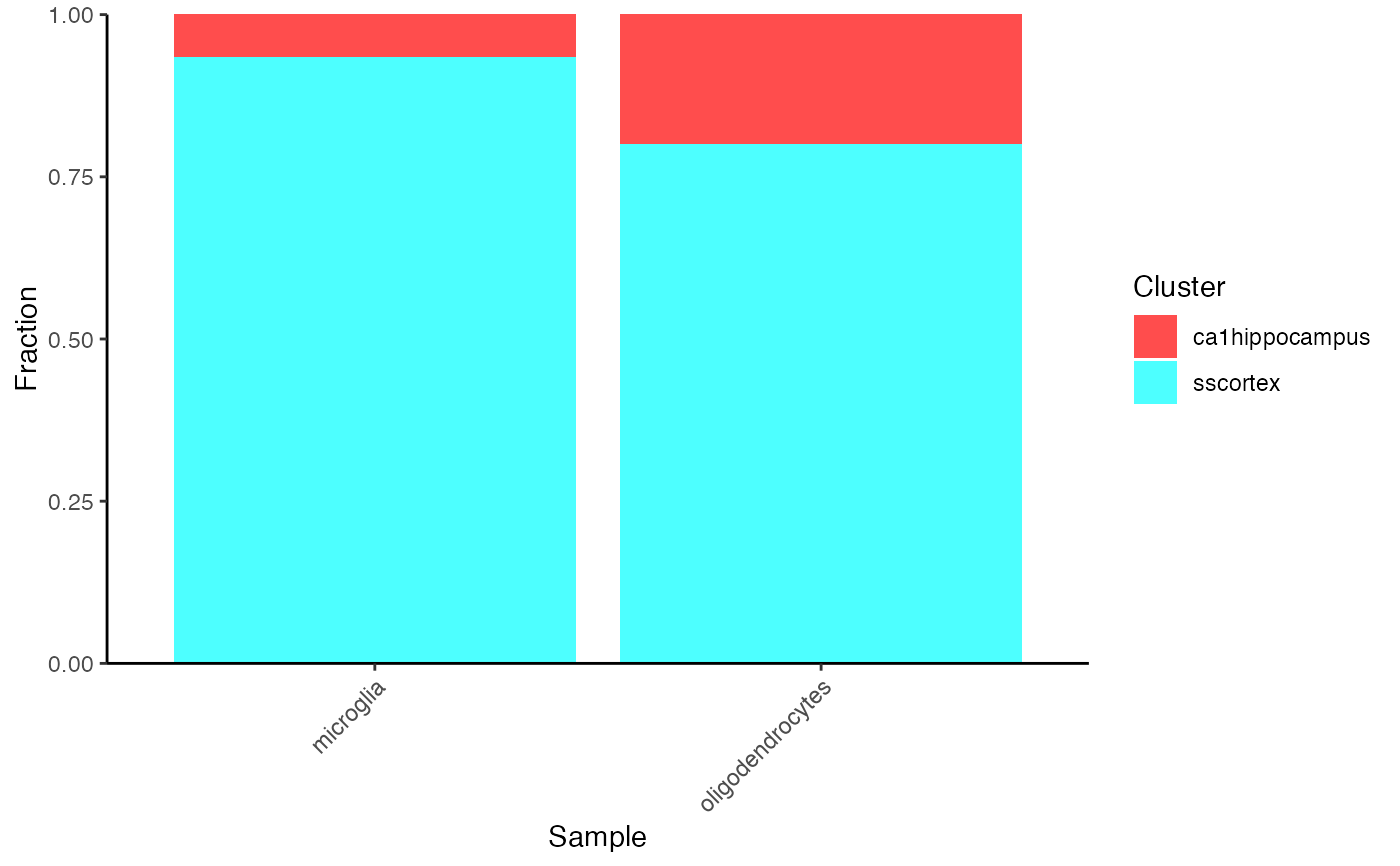
A list with 4 ggplot objects.
Details
This function will visualize the differential abundance in two given variables, by making bar plots that presents the cell counting and fraction in different cases.
Examples
data("mouseBrainSubsetSCE", package = "singleCellTK") plotClusterAbundance(inSCE = mouseBrainSubsetSCE, cluster = "tissue", variable = "level1class")#> [[1]]#> #> [[2]]#> #> [[3]]#> #> [[4]]#>