Visualizes values stored in the assay slot of a SingleCellExperiment object via a violin plot.
plotSCEViolinAssayData(
  inSCE,
  feature,
  sample = NULL,
  useAssay = "counts",
  featureLocation = NULL,
  featureDisplay = NULL,
  groupBy = NULL,
  violin = TRUE,
  boxplot = TRUE,
  dots = TRUE,
  xlab = NULL,
  ylab = NULL,
  axisSize = 10,
  axisLabelSize = 10,
  dotSize = 0.5,
  transparency = 1,
  defaultTheme = TRUE,
  gridLine = FALSE,
  summary = NULL,
  title = NULL,
  titleSize = NULL,
  combinePlot = "none",
  plotLabels = NULL
)
Arguments
| inSCE | Input SingleCellExperiment object with saved dimension reduction components or a variable with saved results. Required. |
|---|---|
| feature | Name of feature stored in assay of SingleCellExperiment object. |
| sample | Character vector. Indicates which sample each cell belongs to. |
| useAssay | Indicate which assay to use. Default "counts". |
| featureLocation | Indicates which column name of rowData to query gene. |
| featureDisplay | Indicates which column name of rowData to use to display feature for visualization. |
| groupBy | Groupings for each numeric value. A user may input a vector equal length to the number of the samples in the SingleCellExperiment object, or can be retrieved from the colData slot. Default NULL. |
| violin | Boolean. If TRUE, will plot the violin plot. Default TRUE. |
| boxplot | Boolean. If TRUE, will plot boxplots for each violin plot. Default TRUE. |
| dots | Boolean. If TRUE, will plot dots for each violin plot. Default TRUE. |
| xlab | Character vector. Label for x-axis. Default NULL. |
| ylab | Character vector. Label for y-axis. Default NULL. |
| axisSize | Size of x/y-axis ticks. Default 10. |
| axisLabelSize | Size of x/y-axis labels. Default 10. |
| dotSize | Size of dots. Default 0.5. |
| transparency | Transparency of the dots, values will be 0-1. Default 1. |
| defaultTheme | Removes grid in plot and sets axis title size to 10 when TRUE. Default TRUE. |
| gridLine | Adds a horizontal grid line if TRUE. Will still be drawn even if defaultTheme is TRUE. Default FALSE. |
| summary | Adds a summary statistic, as well as a crossbar to the violin plot. Options are "mean" or "median". Default NULL. |
| title | Title of plot. Default NULL. |
| titleSize | Size of title of plot. Default 15. |
| combinePlot | Must be either "all", "sample", or "none". "all" will combine all plots into a single .ggplot object, while "sample" will output a list of plots separated by sample. Default "none". |
| plotLabels | labels to each plot. If set to "default", will use the name of the samples as the labels. If set to "none", no label will be plotted. |
Value
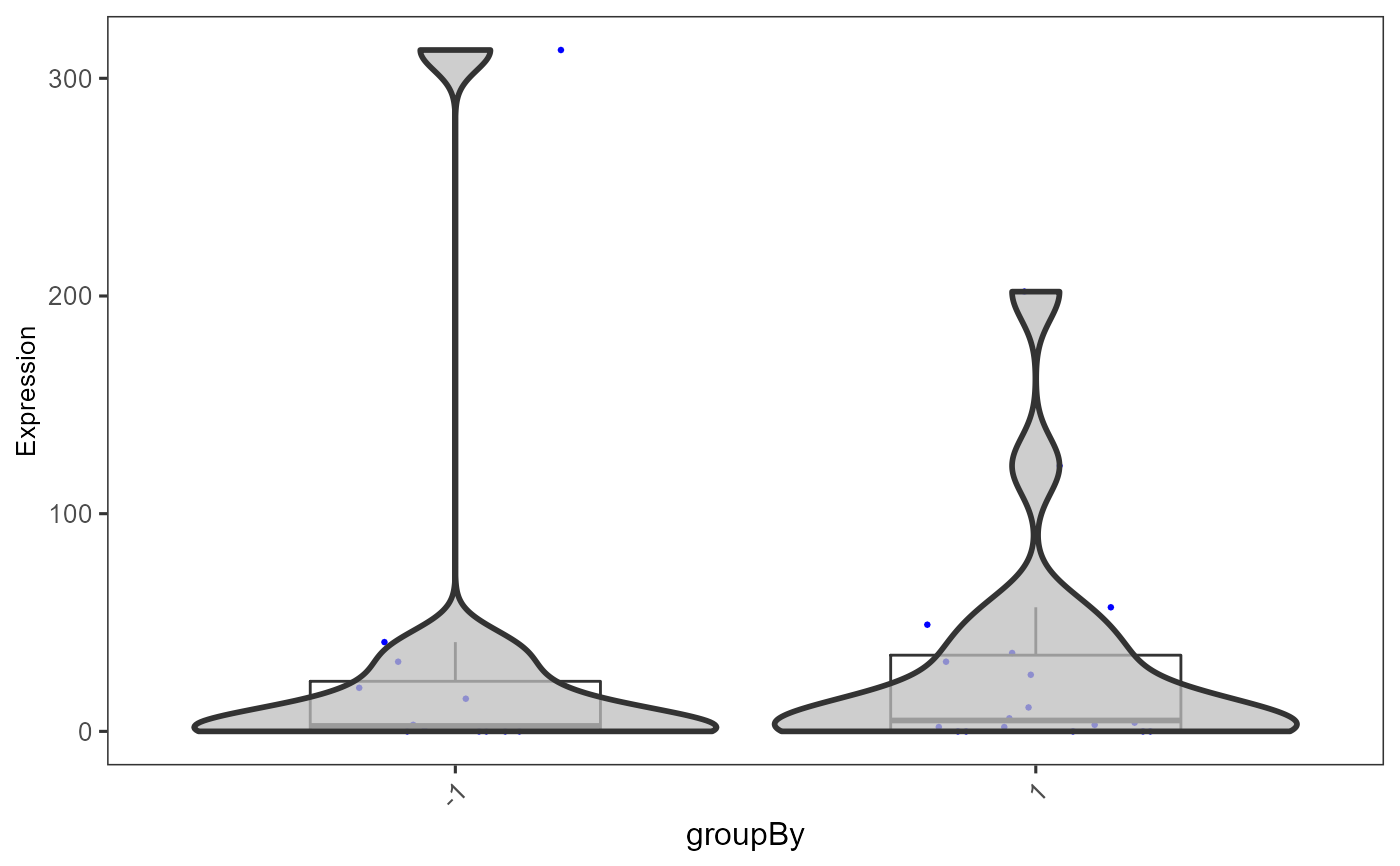
a ggplot of the violin plot of assay data.
Examples
plotSCEViolinAssayData(
  inSCE = mouseBrainSubsetSCE,
  feature = "Apoe", groupBy = "sex"
)