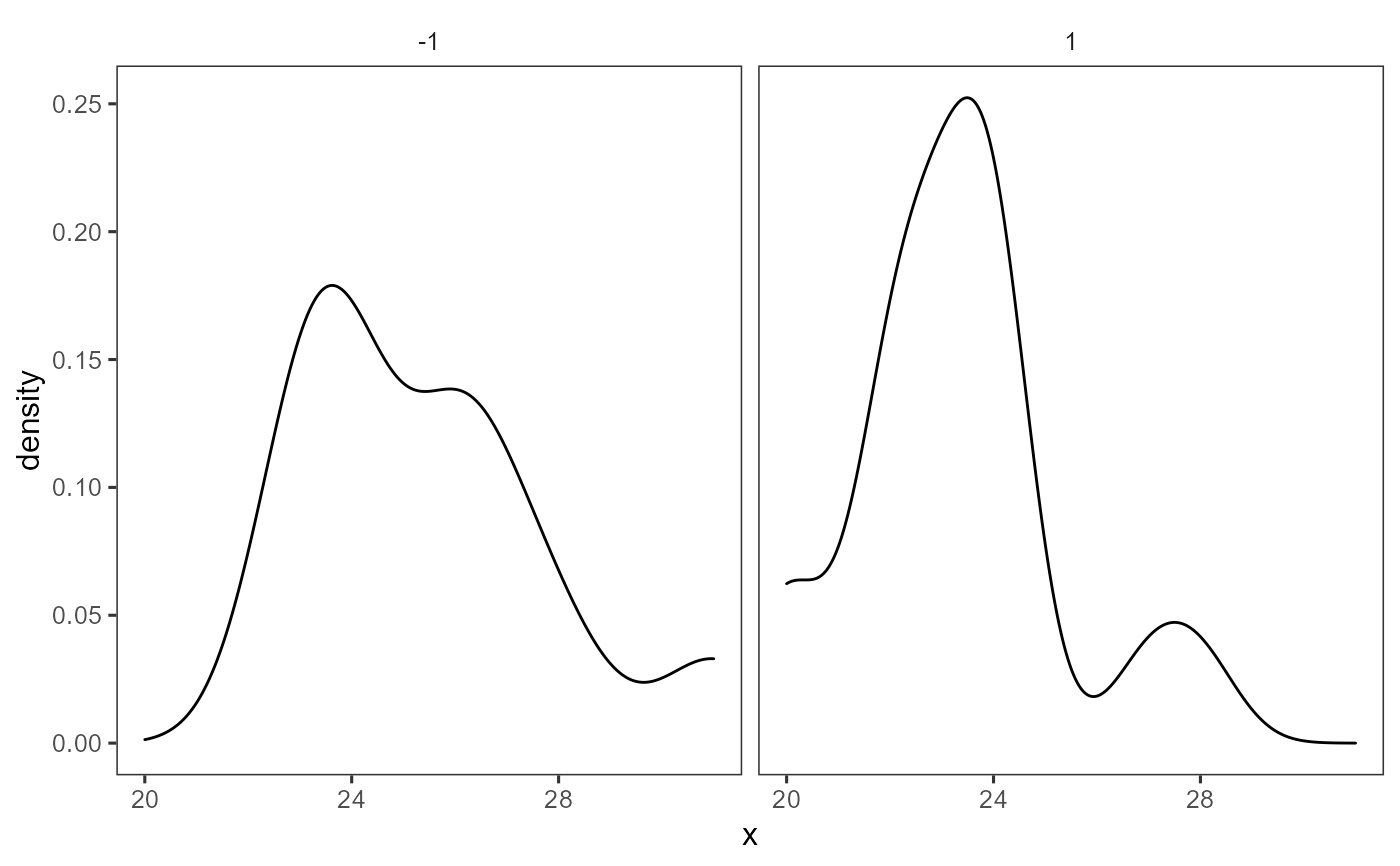
Visualizes values stored in the colData slot of a SingleCellExperiment object via a density plot.
plotSCEDensityColData(
  inSCE,
  coldata,
  sample = NULL,
  groupBy = NULL,
  xlab = NULL,
  ylab = NULL,
  baseSize = 12,
  axisSize = NULL,
  axisLabelSize = NULL,
  defaultTheme = TRUE,
  title = NULL,
  titleSize = 18,
  cutoff = NULL,
  combinePlot = "none",
  plotLabels = NULL
)
Arguments
| inSCE | Input SingleCellExperiment object with saved dimension reduction components or a variable with saved results. Required. |
|---|---|
| coldata | colData value that will be plotted. |
| sample | Character vector. Indicates which sample each cell belongs to. |
| groupBy | Groupings for each numeric value. A user may input a vector equal length to the number of the samples in the SingleCellExperiment object, or can be retrieved from the colData slot. Default NULL. |
| xlab | Character vector. Label for x-axis. Default NULL. |
| ylab | Character vector. Label for y-axis. Default NULL. |
| baseSize | The base font size for all text. Default 12. Can be overwritten by titleSize, axisSize, and axisLabelSize, legendSize, legendTitleSize. |
| axisSize | Size of x/y-axis ticks. Default NULL. |
| axisLabelSize | Size of x/y-axis labels. Default NULL. |
| defaultTheme | Removes grid in plot and sets axis title size to 10 when TRUE. Default TRUE. |
| title | Title of plot. Default NULL. |
| titleSize | Size of title of plot. Default 15. |
| cutoff | Numeric value. The plot will be annotated with a vertical line if set. Default NULL. |
| combinePlot | Must be either "all", "sample", or "none". "all" will combine all plots into a single .ggplot object, while "sample" will output a list of plots separated by sample. Default "none". |
| plotLabels | labels to each plot. If set to "default", will use the name of the samples as the labels. If set to "none", no label will be plotted. |
Value
a ggplot of the density plot of colData.
Examples
plotSCEDensityColData( inSCE = mouseBrainSubsetSCE, coldata = "age", groupBy = "sex" )#> [[1]]#>