A differential expression analysis function has to be run in advance so that
information is stored in the metadata of the input SCE object. This function
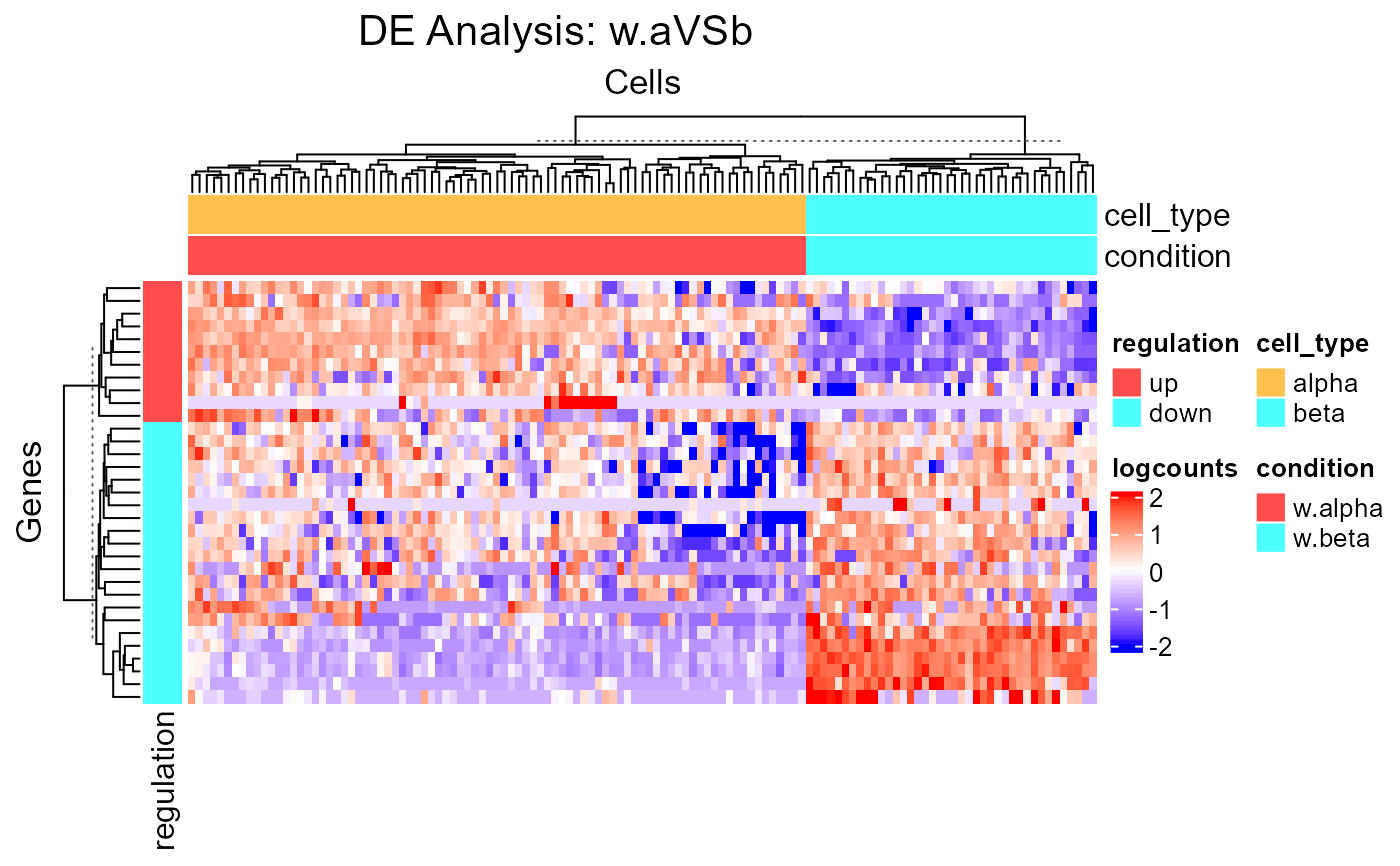
wraps plotSCEHeatmap.
A feature annotation basing on the log2FC level called "regulation"
will be automatically added. A cell annotation basing on the condition
selection while running the analysis called "condition", and the
annotations used from colData(inSCE) while setting the condition and
covariates will also be added.
plotDEGHeatmap(
  inSCE,
  useResult,
  doLog = FALSE,
  onlyPos = FALSE,
  log2fcThreshold = 0.25,
  fdrThreshold = 0.05,
  useAssay = NULL,
  featureAnnotations = NULL,
  cellAnnotations = NULL,
  featureAnnotationColor = NULL,
  cellAnnotationColor = NULL,
  rowDataName = NULL,
  colDataName = NULL,
  colSplitBy = "condition",
  rowSplitBy = "regulation",
  title = paste0("DE Analysis: ", useResult),
  ...
)
Arguments
| inSCE | SingleCellExperiment inherited object.
|
|---|---|
| useResult | character. A string specifying the |
| doLog | Logical scalar. Whether to do |
| onlyPos | logical. Whether to only plot DEG with positive log2_FC
value. Default |
| log2fcThreshold | numeric. Only plot DEGs with the absolute values of
log2FC larger than this value. Default |
| fdrThreshold | numeric. Only plot DEGs with FDR value smaller than this
value. Default |
| useAssay | character. A string specifying an assay of expression value
to plot. By default the assay used for |
| featureAnnotations |
|
| cellAnnotations |
|
| featureAnnotationColor | A named list. Customized color settings for
feature labeling. Should match the entries in the |
| cellAnnotationColor | A named list. Customized color settings for
cell labeling. Should match the entries in the |
| rowDataName | character. The column name(s) in |
| colDataName | character. The column name(s) in |
| colSplitBy | character. Do semi-heatmap based on the grouping of
this(these) annotation(s). Should exist in either |
| rowSplitBy | character. Do semi-heatmap based on the grouping of
this(these) annotation(s). Should exist in either |
| title | character. Main title of the heatmap. Default
|
| ... | Other arguments passed to |
Value
A ComplexHeatmap::Heatmap object
Author
Yichen Wang
Examples
data("sceBatches")
logcounts(sceBatches) <- log(counts(sceBatches) + 1)
sce.w <- subsetSCECols(sceBatches, colData = "batch == 'w'")
sce.w <- runWilcox(sce.w, class = "cell_type", classGroup1 = "alpha",
                   groupName1 = "w.alpha", groupName2 = "w.beta",
                   analysisName = "w.aVSb")
plotDEGHeatmap(sce.w, "w.aVSb")