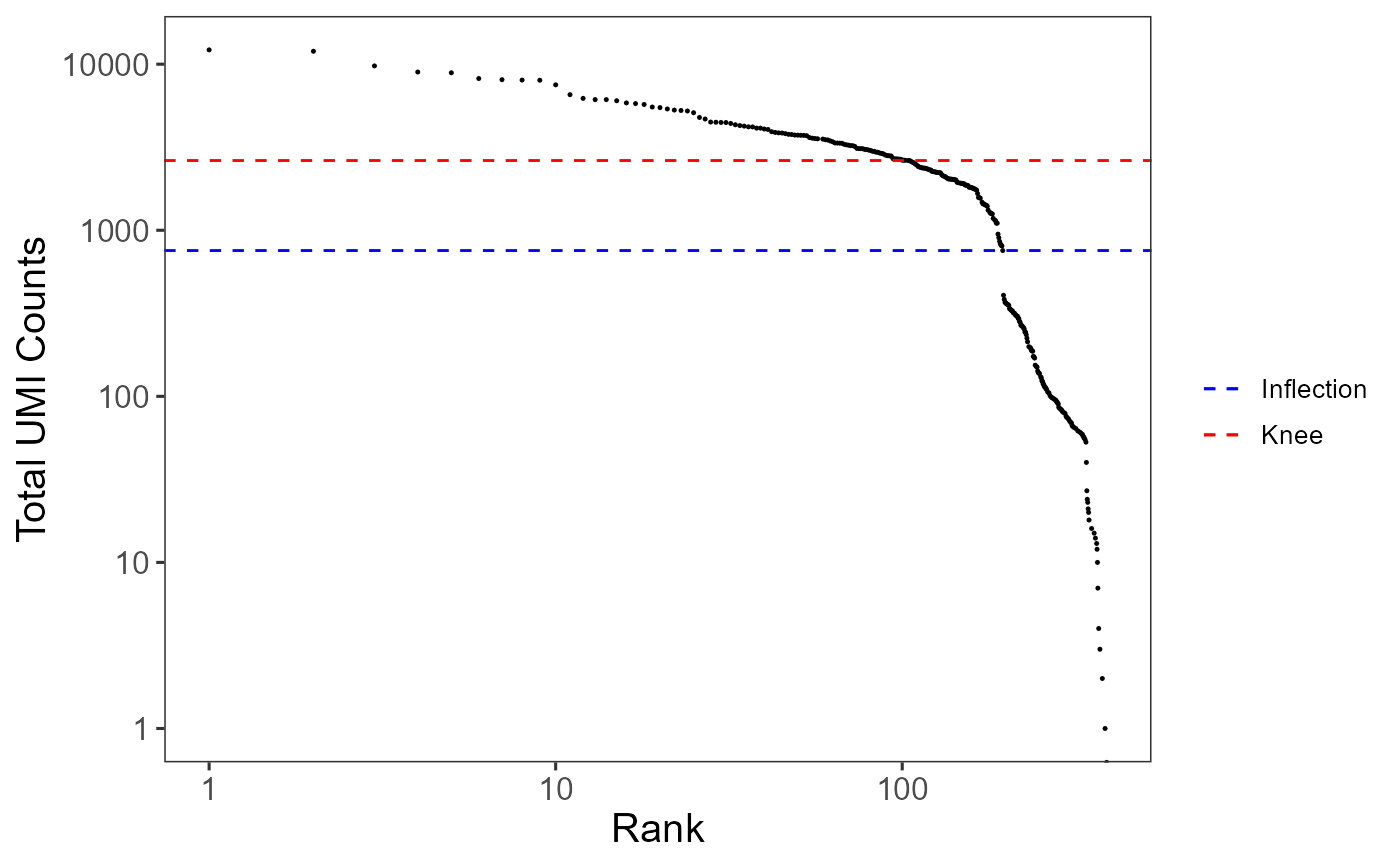
A plotting function which visualizes outputs from the runBarcodeRankDrops function stored in the colData slot of the SingleCellExperiment object via scatterplot.
plotBarcodeRankScatter(
  inSCE,
  sample = NULL,
  defaultTheme = TRUE,
  dotSize = 0.5,
  title = NULL,
  titleSize = 18,
  xlab = NULL,
  ylab = NULL,
  axisSize = 12,
  axisLabelSize = 15,
  legendSize = 10,
  combinePlot = "none",
  sampleRelHeights = 1,
  sampleRelWidths = 1
)
Arguments
| inSCE | Input SingleCellExperiment object with saved dimension reduction components or a variable with saved results from runBarcodeRankDrops. Required. |
|---|---|
| sample | Character vector. Indicates which sample each cell belongs to. Default NULL. |
| defaultTheme | Removes grid in plot and sets axis title size to 10 when TRUE. Default TRUE. |
| dotSize | Size of dots. Default 0.5. |
| title | Title of plot. Default NULL. |
| titleSize | Size of title of plot. Default 18. |
| xlab | Character vector. Label for x-axis. Default NULL. |
| ylab | Character vector. Label for y-axis. Default NULL. |
| axisSize | Size of x/y-axis ticks. Default 12. |
| axisLabelSize | Size of x/y-axis labels. Default 15. |
| legendSize | size of legend. Default 10. |
| combinePlot | Boolean. If multiple plots are generated (multiple samples, etc.), will combined plots using `cowplot::plot_grid`. |
| sampleRelHeights | If there are multiple samples and combining by "all", the relative heights for each plot. |
| sampleRelWidths | If there are multiple samples and combining by "all", the relative widths for each plot. Default TRUE. |
Value
a ggplot object of the scatter plot.
Examples
#>plotBarcodeRankScatter(inSCE=sce)#> Warning: Transformation introduced infinite values in continuous y-axis