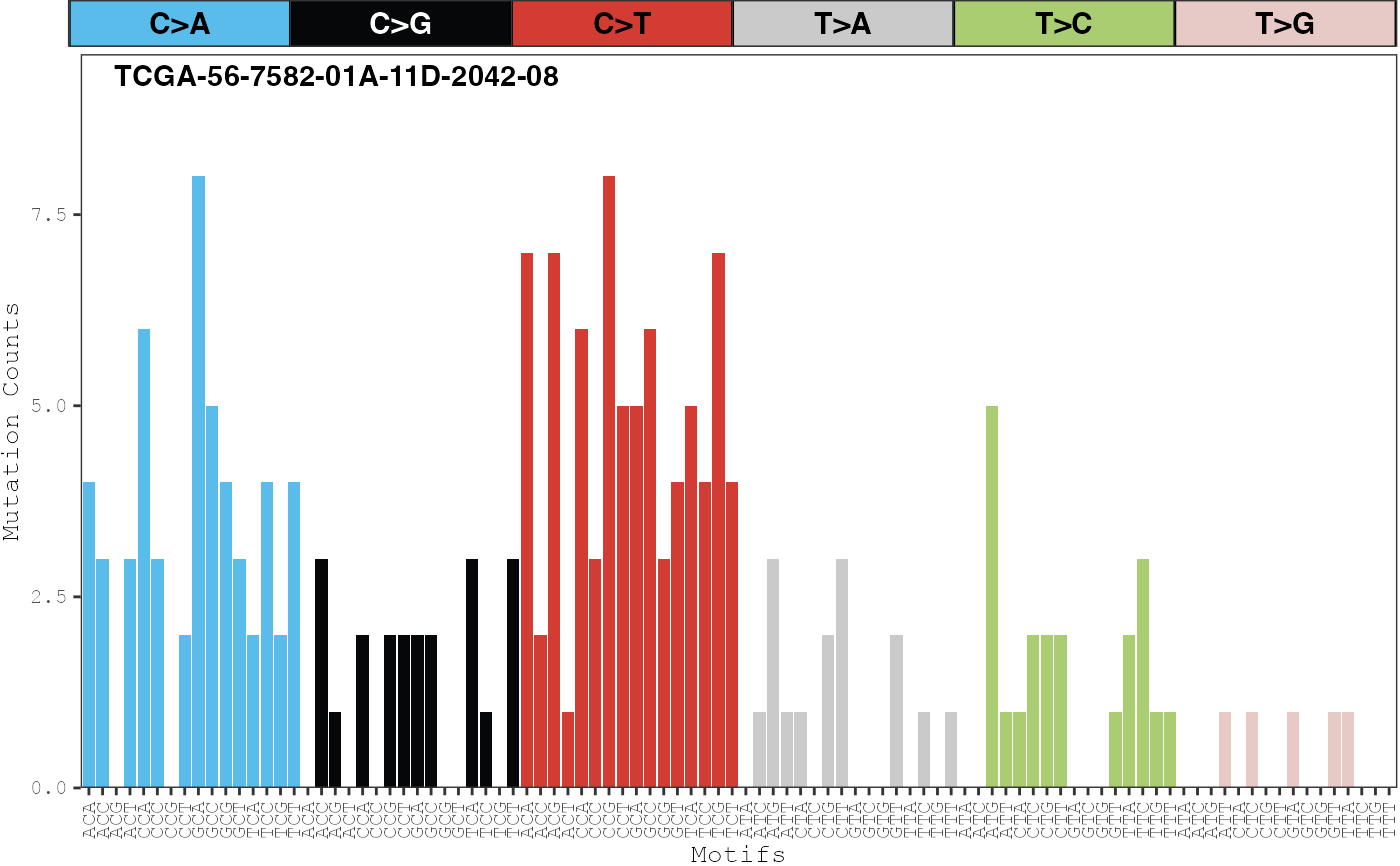
Displays the proportion of counts for each mutation type across one or more samples.
plot_sample_counts(
  musica,
  sample_names,
  table_name = NULL,
  text_size = 10,
  show_x_labels = TRUE,
  show_y_labels = TRUE,
  same_scale = TRUE,
  annotation = NULL
)
Arguments
- musica
A
musicaobject.- sample_names
Names of the samples to plot.
- table_name
Name of table used for plotting counts. If
NULL, then the first table in themusicaobject will be used. DefaultNULL.- text_size
Size of axis text. Default
10.- show_x_labels
If
TRUE, the labels for the mutation types on the x-axis will be shown. DefaultTRUE.- show_y_labels
If
TRUE, the y-axis ticks and labels will be shown. DefaultTRUE.- same_scale
If
TRUE, the scale of the y-axis for each sample will be the same. IfFALSE, then the scale of the y-axis will be adjusted for each sample. DefaultTRUE.- annotation
Vector of annotations to be displayed in the top right corner of each sample. Vector length must be equivalent to the number of samples. Default
NULL.
Value
Generates a ggplot object
Examples
data(musica_sbs96)
plot_sample_counts(musica_sbs96, sample_names =
sample_names(musica_sbs96)[1])