To help decide the number of cluster, three different methods are provided: total within cluster sum of squares, average silhouette coefficient, and gap statistics.
k_select(
  result,
  method = "wss",
  clust.method = "kmeans",
  n = 10,
  proportional = TRUE
)
Arguments
- result
A
musica_resultobject generated by a mutational discovery or prediction tool.- method
A single character string indicating which statistic to use for plot. Options are "wss" (total within cluster sum of squares), "silhouette" (average silhouette coefficient), and "gap_stat" (gap statistic). Default is "wss".
- clust.method
A character string indicating clustering method. Options are "kmeans" (default), "hclust" (hierarchical clustering), "hkmeans", "pam", and "clara".
- n
An integer indicating maximum number of clusters to test. Default is 10.
- proportional
Logical, indicating if proportional exposure (default) will be used for clustering.
Value
A ggplot object.
See also
Examples
data(res_annot)
set.seed(123)
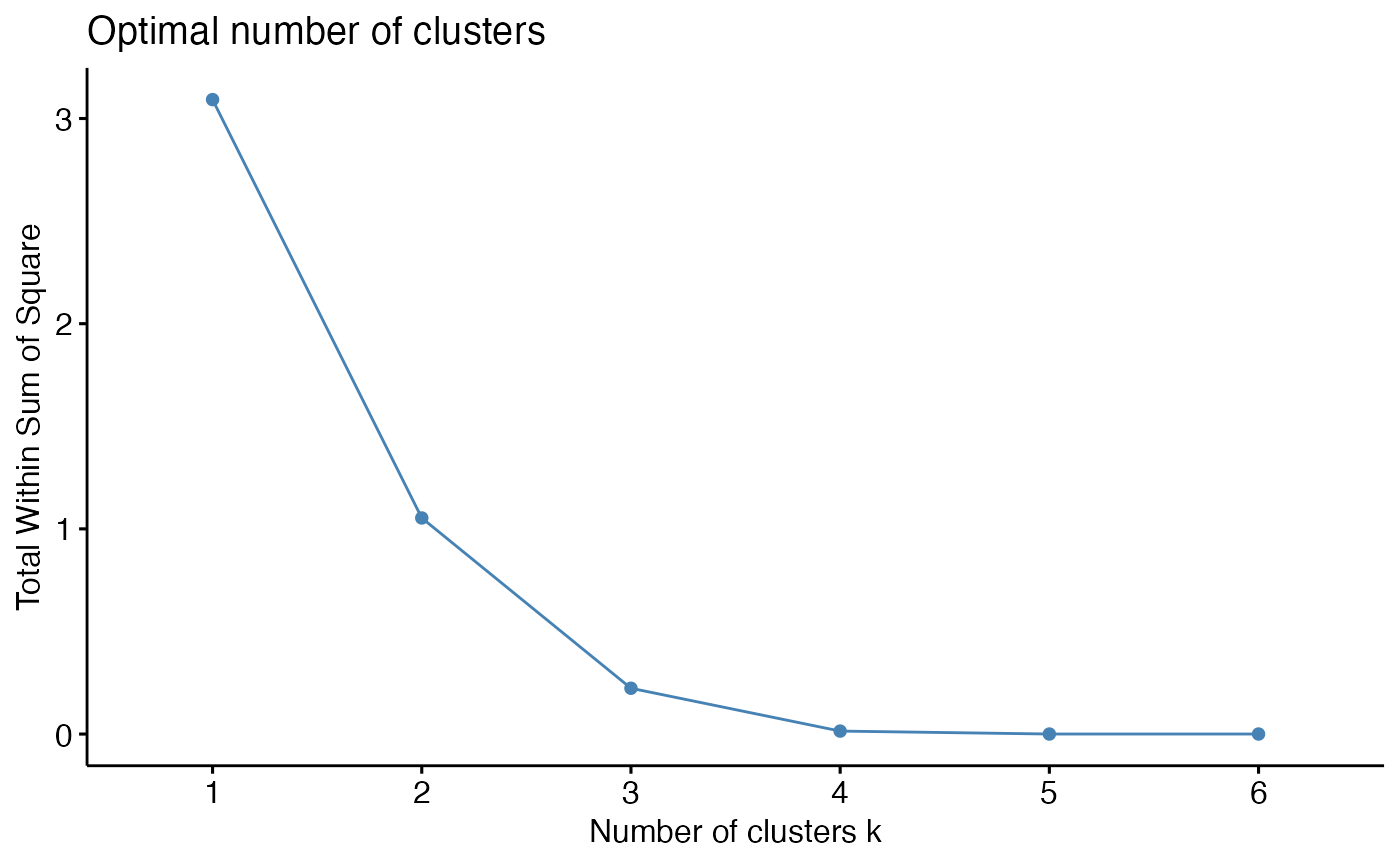
#Make an elbow plot
k_select(res_annot, method = "wss", n = 6)
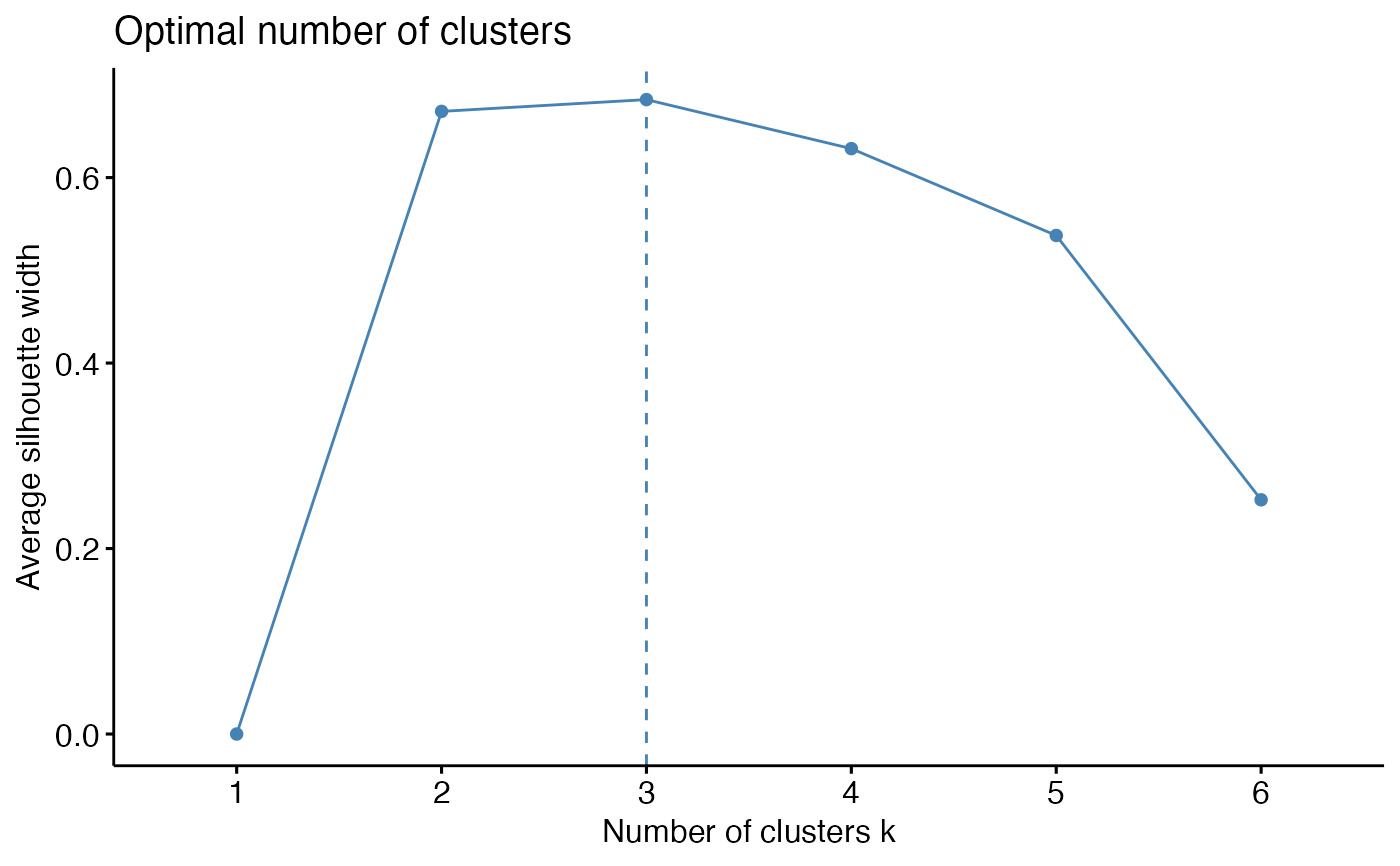
 #Plot average silhouette coefficient against number of clusters
k_select(res_annot, method = "silhouette", n = 6)
#Plot average silhouette coefficient against number of clusters
k_select(res_annot, method = "silhouette", n = 6)
 #Plot gap statistics against number of clusters
k_select(res_annot, method = "gap_stat", n = 6)
#Plot gap statistics against number of clusters
k_select(res_annot, method = "gap_stat", n = 6)
